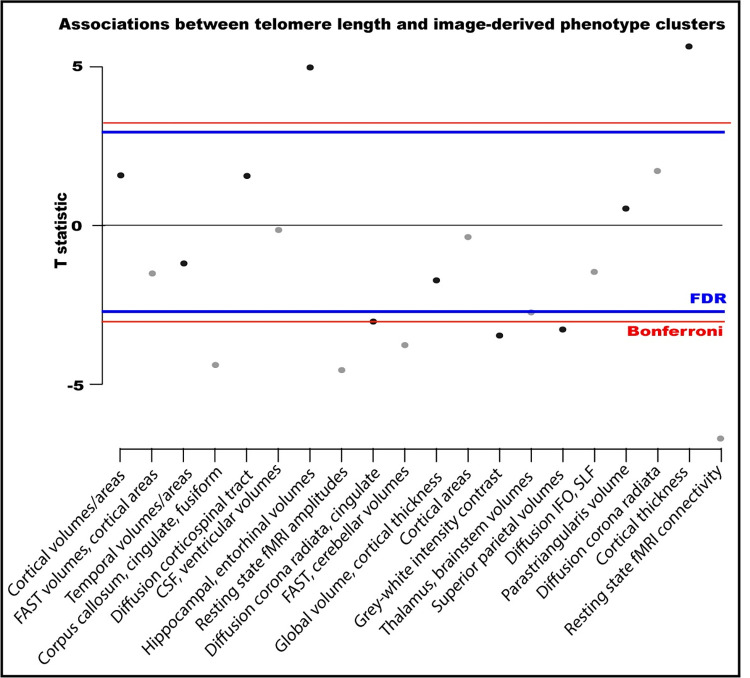
Fig 3. Associations between leucocyte telomere length and imaging clusters from an independent components analysis-based dimensionality reduction on 3921 image-derived phenotypes.
Associations were adjusted for all imaging-related confounders, age, age2, age3, sex, age*sex, smoking, alcohol intake, body mass index, leucocyte count, genetic ancestry. Constituents of clusters are in S5 Table. Multiple testing T statistic thresholds were calculated on the basis of 20 tests: False Discovery Rate (FDR) = 2.50, Bonferroni = 3.02.

