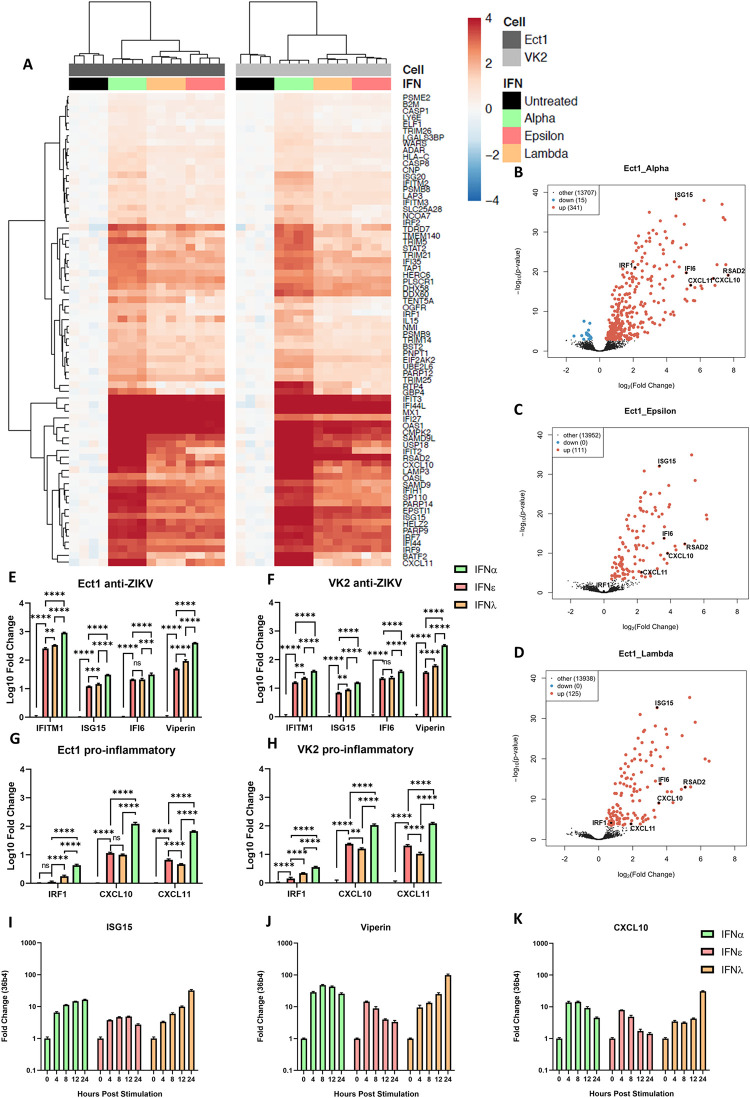
Fig 3. IFNε displays typical type-I IFN kinetics but induces an antiviral gene signature like IFNλ-3 at early time points in ectocervical and vaginal cells.
Ect1 and VK2 cells were treated with IFNε, IFNα-2a or IFNλ-3 (100 ng/mL) or left untreated (n = 4) for 6hr prior to RNA-seq analysis (NextSeq550 V2.5). Differentially expressed genes were determined with a 1.2-fold cut-off and adjusted p-value < 0.05. A) Heat map showing expression of key ISGs. B, C & D) Volcano plots indicating up or downregulation of genes after IFNα-2a, IFNε or IFNλ-3 treatment, respectively. E & F) Confirmation of anti-ZIKV ISGs (ISG15, IFI6, IFITM1, Viperin) expression by qRT-PCR. G & H) Confirmation of pro-inflammatory ISGs (IRF1, CXCL10, CXCL11) expression by qRT-PCR. Statistical analyses for E-G were performed separately for each gene by one-way ANOVA. I, J & K) Ect1 cells were treated with IFNε, IFNα-2a or IFNλ-3 (100 ng/mL) and RNA was harvested from untreated cells (t = 0) and at the indicated time points post stimulation. qRT-PCR was performed to detect expression of ISG15, Viperin and CXCL10.

