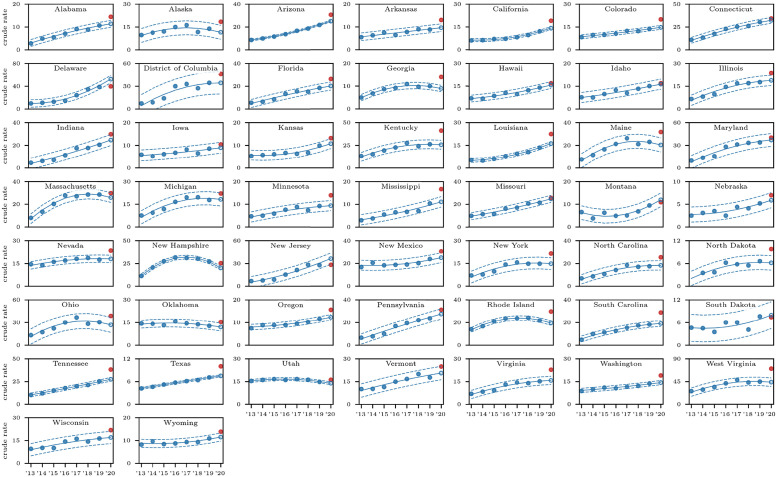
Fig 2. State-by-state fatal overdose trends for all races, all genders and all drug types, i.e. fentanyl (T40.4), methamphetamines (T43.6), prescription opioids (T43.6) and heroin (T40.1).
Solid lines represent the 2013–2019 quadratic regression; dotted lines correspond to values three times above and below the regression by three times the standard deviation calculated from 2013–2019 data; the open circle is the 2020 projection, the filled red dot is the actual data. Note that in most states (but not all) an increasing 2013–2019 trend and that the 2020 value exceeds projections. In New Jersey and Delaware, crude rates were less than those predicted based on the 2013–2019 quadratic regression. There is insufficient data for North Dakota.

