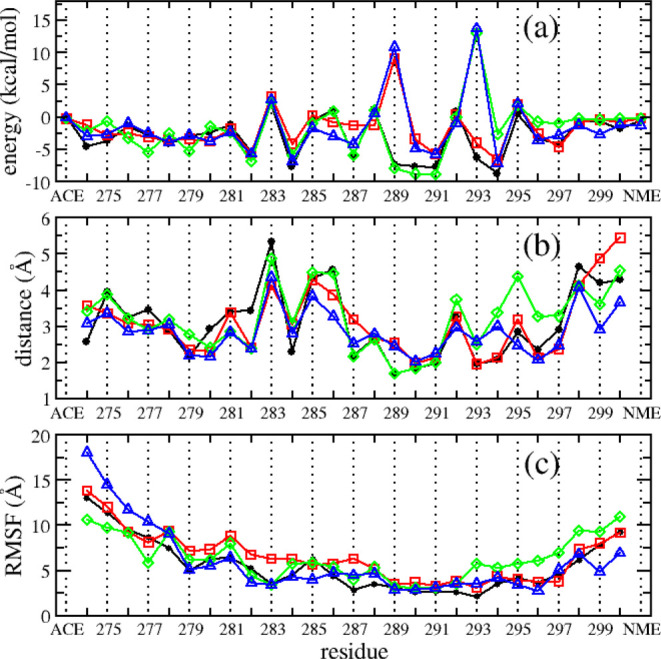
Figure 3.

Contributions of individual residues of R2–MT binding free energy (a), the distance of R2 residues to MT tubulins (b), and mean R2 peptides’ per-residue RMSF (c). Data of R2-WT, R2-pSer289, R2-pSer293, and R2-pSer289 + pSer293 systems were illustrated by black, red, green, and blue lines and markers, respectively. The data were calculated using the last 150 ns of five individual MD trajectories for each system.
