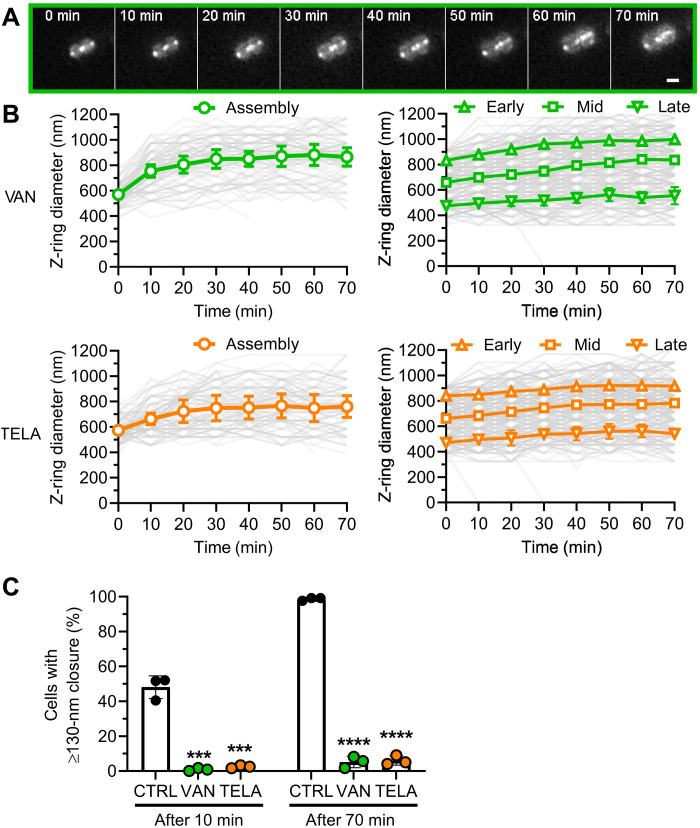
Fig. 3. Glycopeptides vancomycin and telavancin lead to immediate arrest of septum progression.
(A) Representative HiLo microscopy images of Z-ring dynamics over time during vancomycin treatment. Scale bar, 1 μm. (B) Quantification of Z-ring dynamics over time after classification of cell cycle states and cell division stages according to Z-ring size at t = 0 min. Green: cells treated with vancomycin; orange: cells treated with telavancin. Individual cell data are plotted as thin semitransparent lines. Black thick lines with open symbols show the mean of three independent biological experiments ± SD. Open symbols correspond to the time points when the cells were imaged. (C) Quantification of active septum progression. Points correspond to values of individual replicates, and bar shows the mean of three independent biological experiments ± SD. The number of individual cells per replicate are shown in table S2 for all datasets. Statistical significance was determined against the untreated control with unpaired two-tailed Student’s t tests with a 95% confidence interval. Statistical significance was denoted ***P = 0.001 to 0.0001; ****P ≤ 0.0001.

