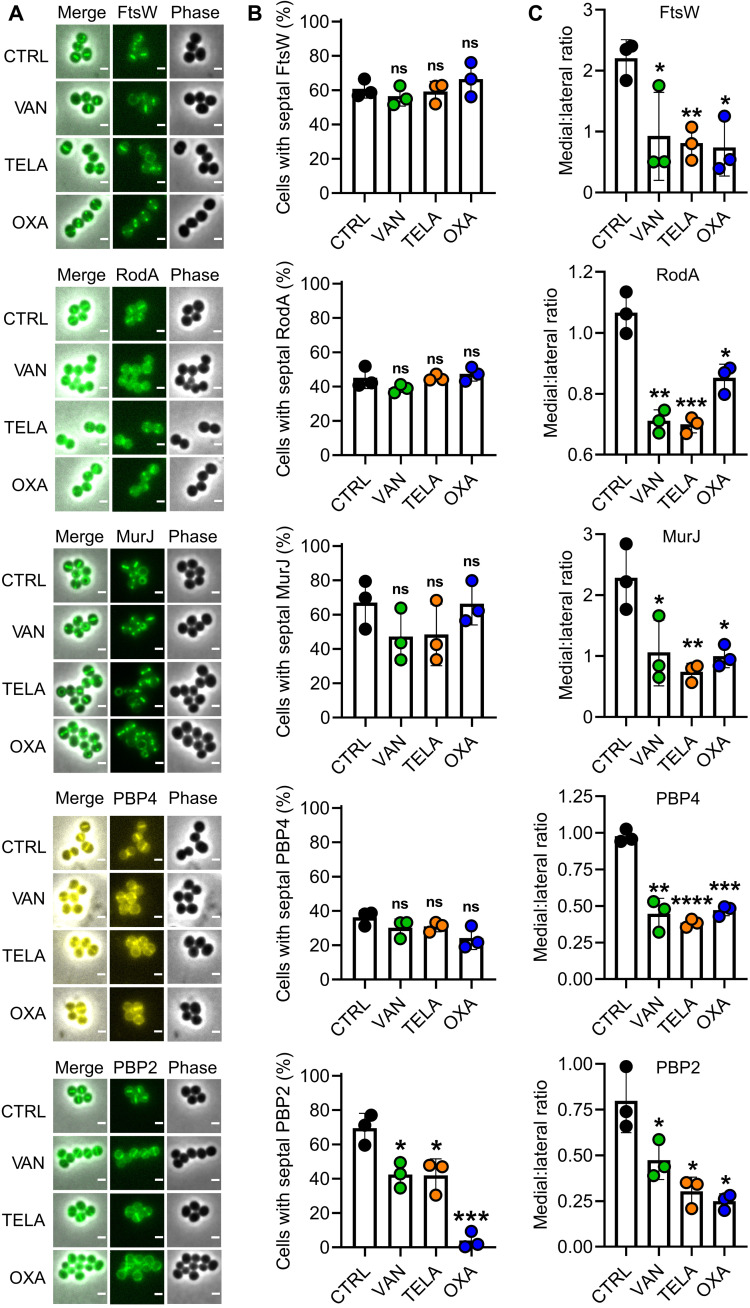
Fig. 5. Impact of antibiotic treatment on CWBM components localizing to the septum.
(A) Representative micrographs of S. aureus RN4220 FtsW-gfp, S. aureus RN4220 RodA-gfp, S. aureus RN4220 pCQ11-MurJ-mNeongreen, S. aureus RN4220 pCQ11-PBP4-YFP, and S. aureus RN4220 RNpPBP2-31 after 25 min of treatment with vancomycin, telavancin, or oxacillin and an untreated control. (B) Relative abundance of cells with septal FtsW, RodA, MurJ, PBP4, and PBP2 localization as % of total population after 25 min of treatment with vancomycin, telavancin, or oxacillin and an untreated control. Boxes and thin lines report the mean of three independent biological experiments ± SD, respectively. Points indicate the values of the individual replicates. (C) Medial:lateral ratios of CAP brightness profiles of FtsW, RodA, MurJ, PBP4, and PBP2 localization after 25 min of treatment with vancomycin, telavancin, or oxacillin and an untreated control. Ratios were determined as the ratio of medial maximum to the mean of both lateral maxima. CAPs and brightness profiles are shown in fig. S3. Boxes and thin lines report the mean of three independent biological experiments ± SD, respectively. Points indicate the values of the individual replicates. The number of individual cells per replicate are shown in table S2 for all datasets. Statistical significance was determined against the untreated control with unpaired two-tailed Student’s t tests with a 95% confidence interval. Statistical significance was denoted as ns, P > 0.05; *P = 0.05 to 0.01; **P = 0.01 to 0.001; ***P = 0.001 to 0.0001; ****P ≤ 0.0001.

