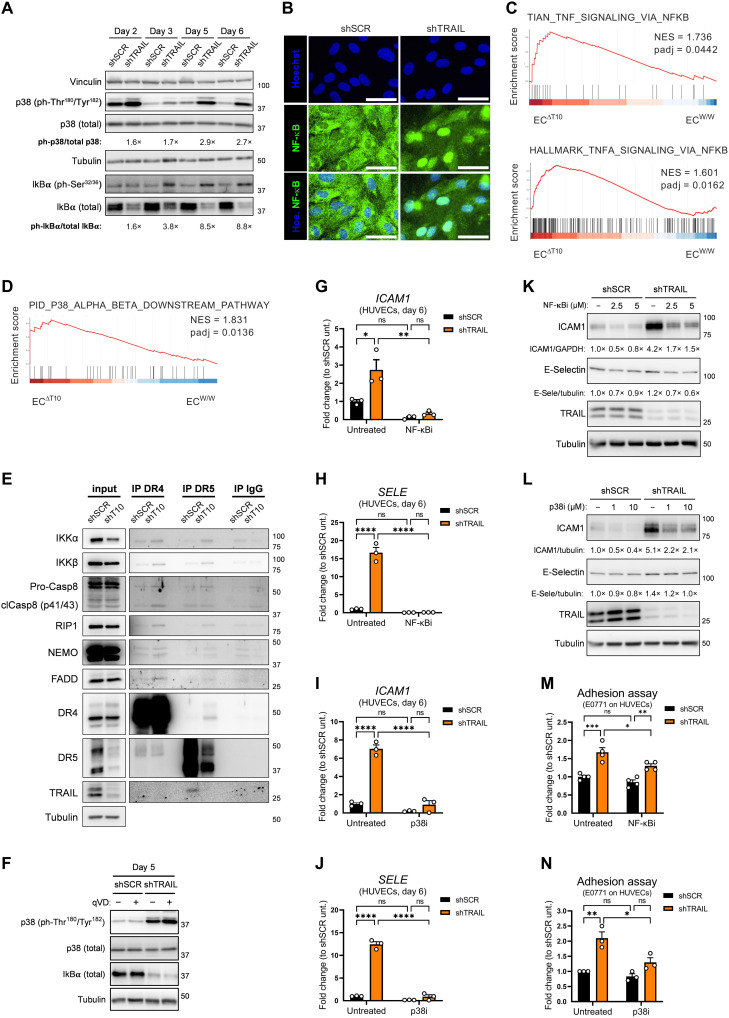
Fig. 8. Activation of p38 and NF-κB underlies the proadhesive state of the endothelium upon TRAIL depletion.
(A) Protein levels of p38 (total and ph-Thr180/Tyr182) and IκBα (total and ph-Ser32/36) in shSCR or shTRAIL HUVECs. For each time point, the densitometry fold change of shTRAIL toward shSCR is indicated. For TRAIL knockdown efficiency, see Fig. 6B. (B) Immunofluorescence staining of NF-κB (green) and Hoechst (blue) in shSCR or shTRAIL HUVECs. Scale bars, 20 μm. (C and D) GSEA enrichment plots showing the comparison of the gene expression profiles in lung ECs sorted from tumor-free induced ECW/W and ECΔT10 mice. (E) Coimmunoprecipitation (co-IP) of DR4, DR5, or IgG control in HUVECs at day 3, showing protein levels of IKKα, ΙΚΚβ, caspase-8, RIP1, NEMO, FADD, DR4, DR5, and TRAIL. Input = WCE. (F) Protein levels of p38 (total and ph-Thr180/Tyr182) and total IκBα in shSCR and shTRAIL HUVECs at day 5 treated with the pan-caspase inhibitor qVD (50 μM) since day 0. For TRAIL knockdown efficiency and caspase cleavage inhibition, see Fig. 6F. (G to J) mRNA expression of ICAM1 (G and I) and SELE (H and J) in shSCR and shTRAIL HUVECs at day 6 treated either with the IκB inhibitor IKK-16 (NF-κBi; 2,5 μM) (G and H) or with the p38 inhibitor SB203580 (p38i; 10 μM) (I and J) since day 4. (K and L) Protein levels of ICAM1, E-Selectin, and TRAIL in shSCR and shTRAIL HUVECs at day 6 treated either with NF-κBi (2.5 or 5 μM) (K) or with p38i (1 or 10 μM) (L) since day 4. (M and N) E0771 cancer cells adhered to shSCR and shTRAIL HUVEC monolayers at day 6 after 1 hour of contact. HUVECs were treated either with NF-κBi (2.5 μM) for 24 hours (M) or with p38i (10 μM) for 48 hours (N). All graphs show means ± SEM. *P < 0.05; **P < 0.01; ***P < 0.001; ****P < 0.0001.

