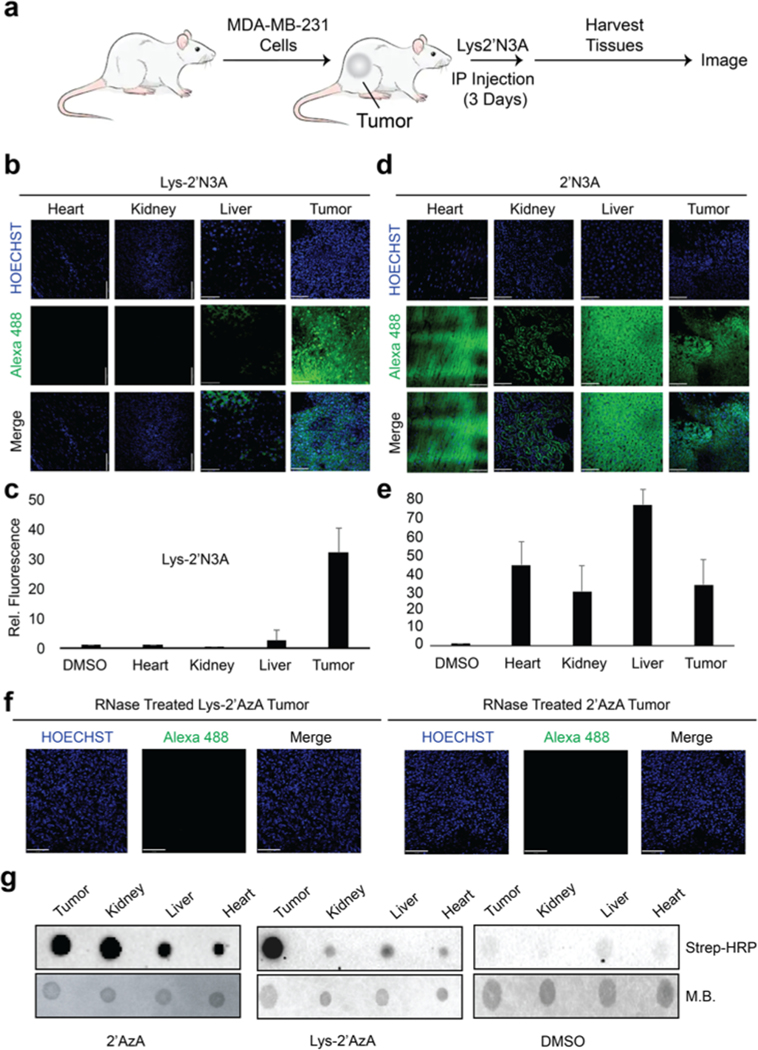
Figure 3.
Imaging cell-specific RNA labeling in vivo. (a) Outline of experiments used for RNA labeling in vivo. 100 μL of either DMSO, 2′N3A, or Lys2′N3A were IP injected at a concentration of 2 mg/mL once per 24 h over 3 days. After 3 days, the mice were sacrificed, and the tumors and organs were collected and sectioned for imaging. (b) Imaging of isolated organs and tumor tissue from experiments exposing mice to Lys2′N3A. (c) Integration of fluorescence signal from slices represented in panel b. (d) Imaging of isolated organs and tumor tissue from experiments exposing mice to 2′N3A. (e) Integration of fluorescence signal from slices represented in panel d. (f) Imaging experiments demonstrating loss of fluorescent signal after RNase treatment. Sections were then incubated in a 0.2 mg/mL solution of RNase A in 0.5% Triton in 1× PBS pH 7.4 for 1 h, followed by 3× washes with DPBS. Slices were then imaged. (g) Dot blot on isolated RNA from various tissues following IP injection. IP injections were followed as described in panel a. Isolated RNA was then subjected to CuAAC with biotin alkyne. Dot blot was performed as in Figure 2. M.B. = methylene blue dye to demonstrate loading onto the dot blot membrane.

