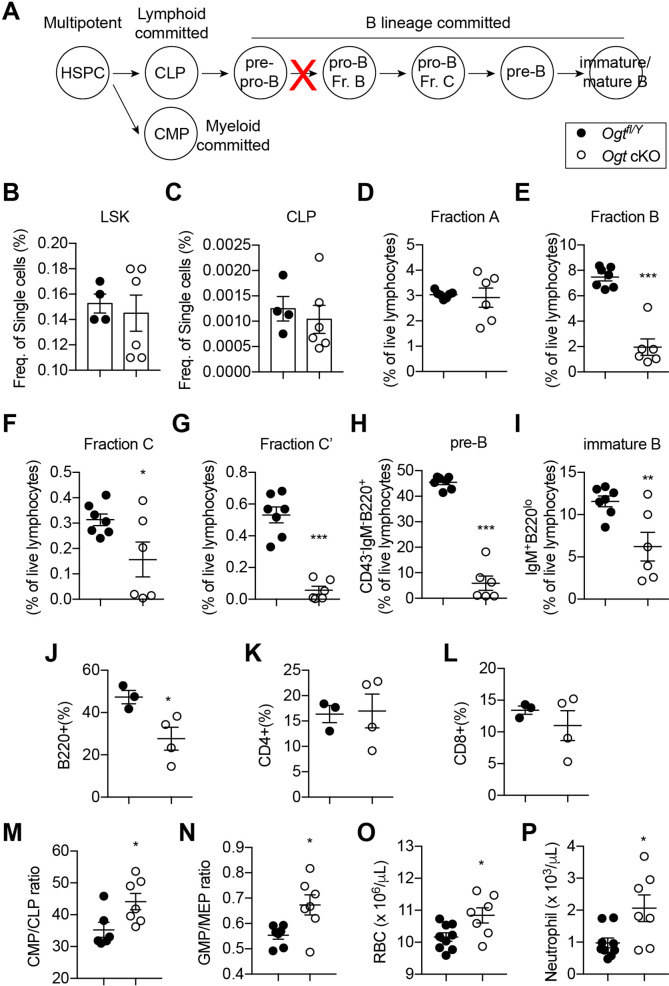
Figure 5. Impaired B lymphopoiesis and myeloid skewing in Ogt cKO mice.
(A) Schematic view of B cell development in the BM and blockade by stromal OGT deficiency (red X). (B–C) Flow cytometric quantification of LSK (B) and CLP (C) among live BM cells (n=4–6). (D–I) Flow cytometric quantification of fraction A (D), fraction B (E), fraction C (F), fraction C’ (G), fraction D (H), and immature B (I) frequencies among live BM lymphocytes (n=6–7). (J–L) Flow cytometric quantification of B220+ B cell (J), CD4+ T cell (K), and CD8+ T cell (L) percentages in the blood (n=3–4). (M, N) CMP/CLP ratio (M) and GMP/EMP ratio (N) in the BM (n=6–7). (O, P) Complete blood counting showing numbers of RBC (O) and neutrophil (P) (n=7–9). Data are presented as mean ± SEM. *, p<0.05; **, p<0.01; and ***, p<0.001 by unpaired student’s t-test.


