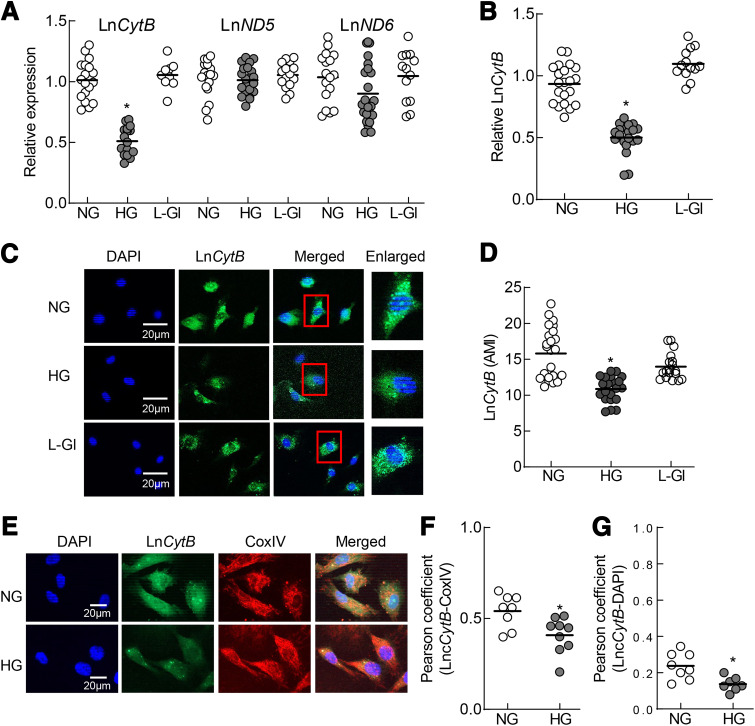
Figure 1.
Effect of HG on mtDNA-encoded LncRNAs. A: Transcripts of LncCytB, LncND5, and LncND6 were quantified by quantitative RT-PCR using β-actin as a housekeeping gene. B and C: LncCytB was quantified by strand-specific PCR using strand-specific cDNA as a template (B) and RNA FISH technique (C). D: AMI of LncCytB was determined using Zeiss software. E: Mitochondrial levels of LncCytB were determined by RNA FISH immunofluorescence technique using fluorescein-12-dUTP–labeled LncCytB probe (green) and Texas Red (red)–conjugated secondary antibody against mitochondrial marker CoxIV. F and G: Pearson correlation between LncCytB and CoxIV (F) and DAPI (G) was calculated using a random region of interest from ≥25 cells in each group. Graph data are mean ± SD obtained from three to four different cell preparations, with each measurement made in duplicate. *P < 0.05 vs. NG.

