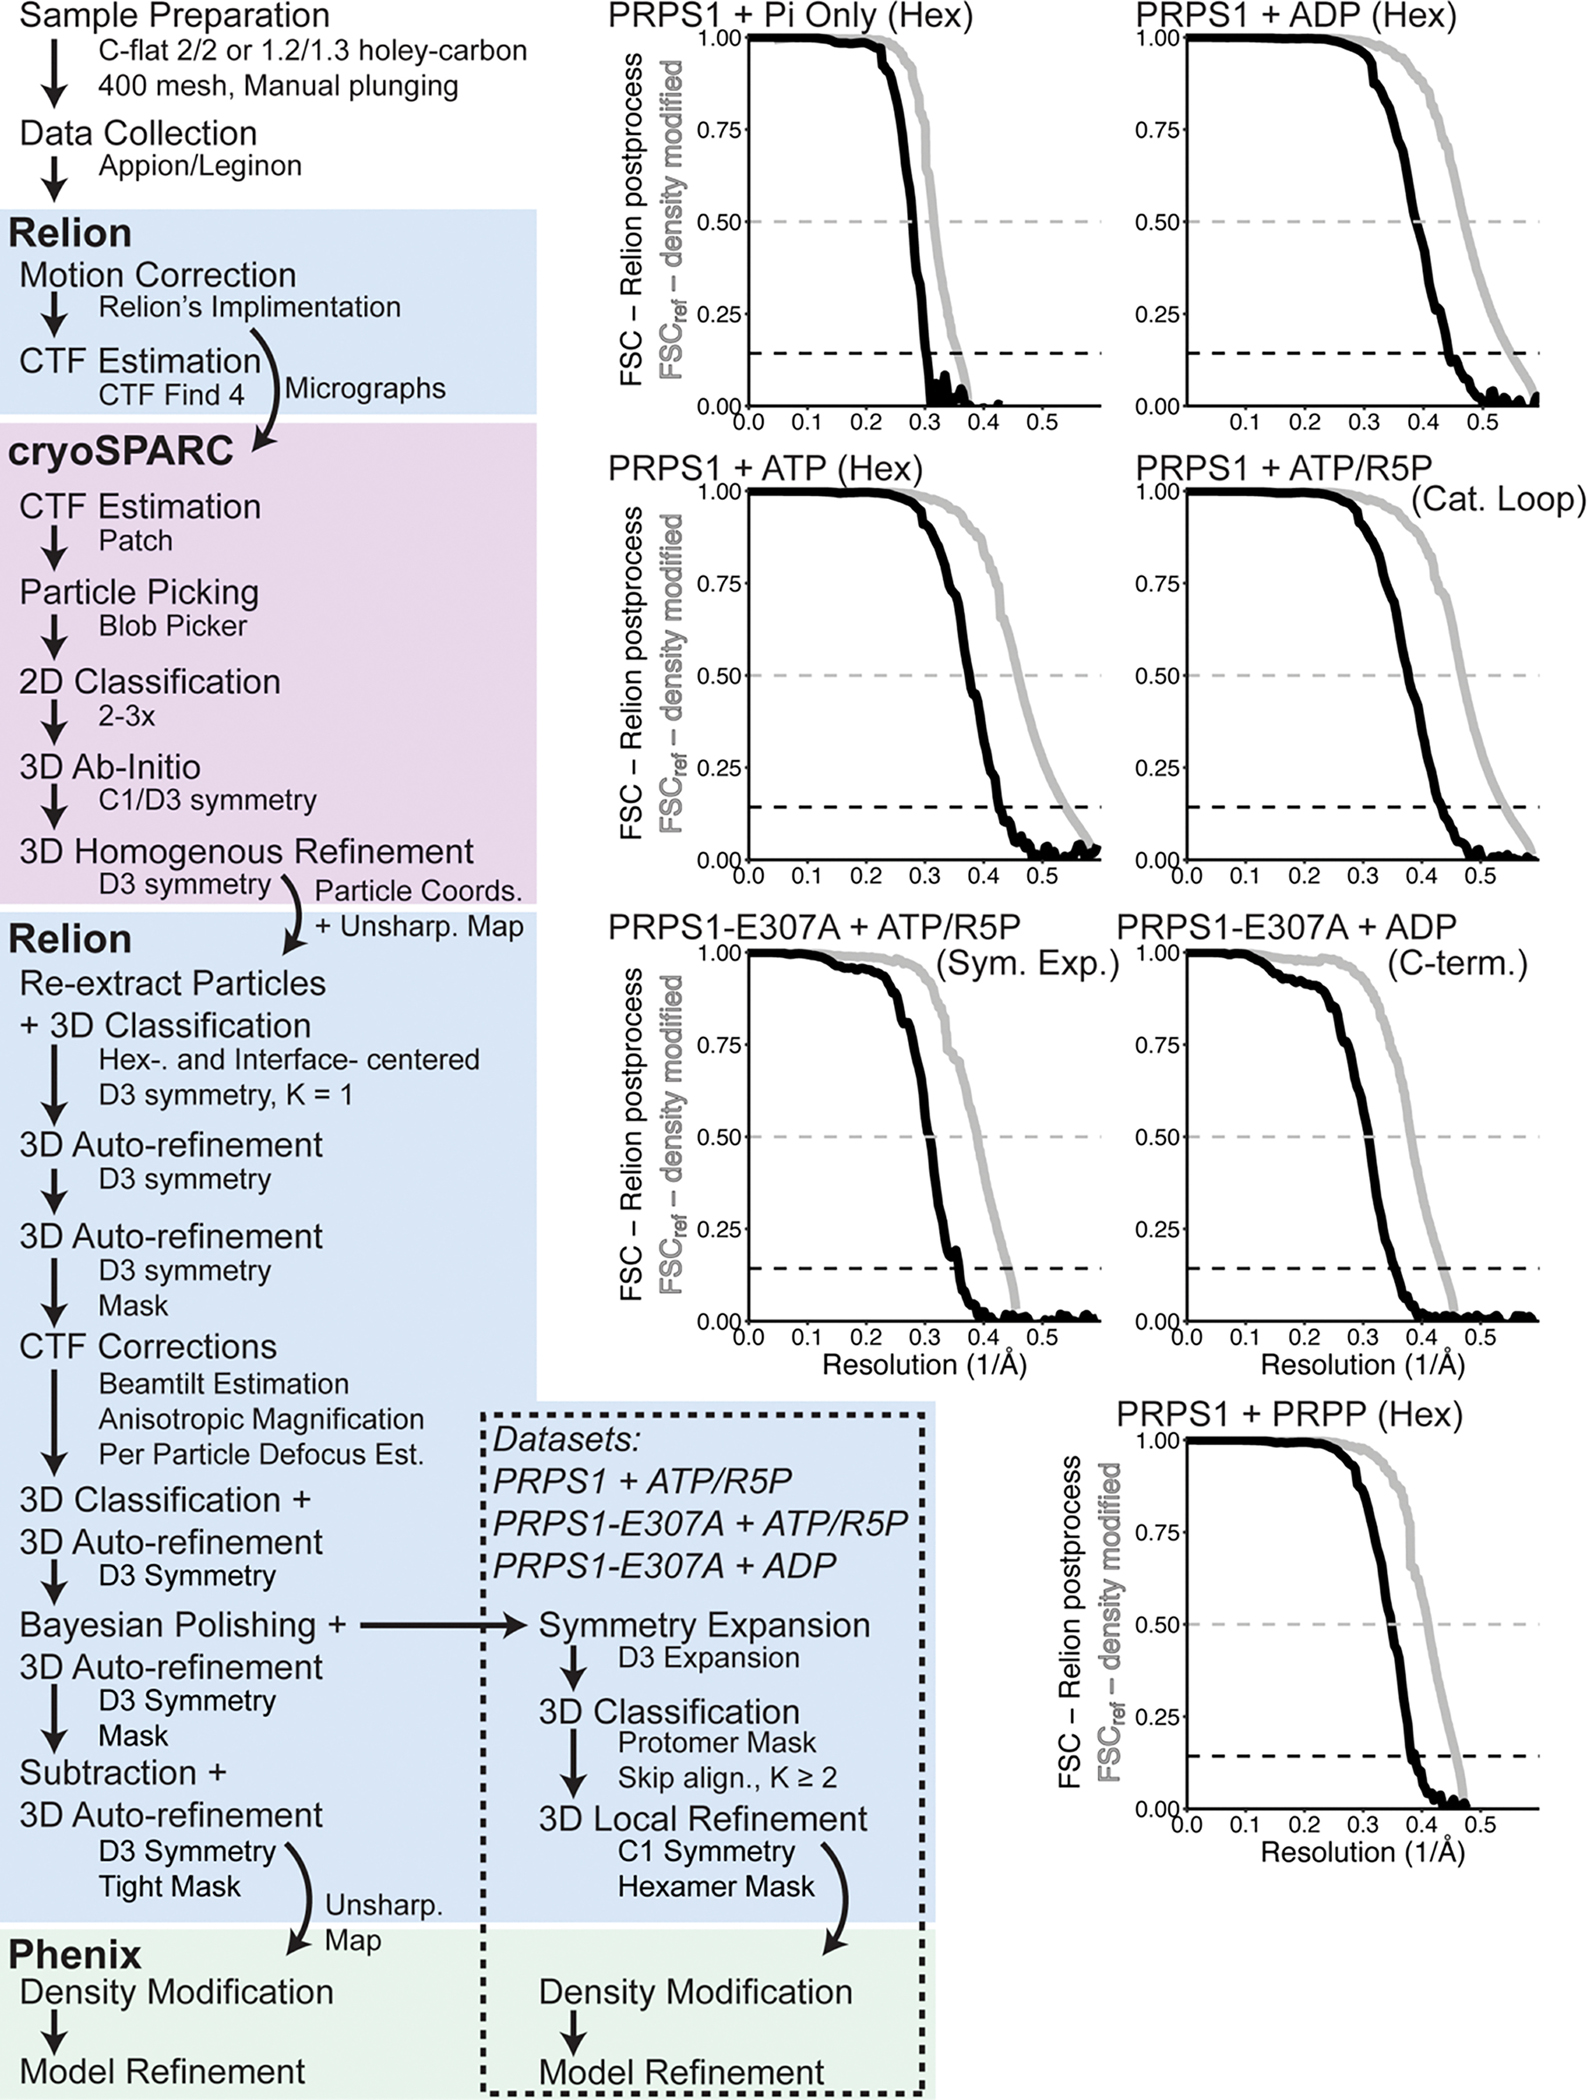
Extended Data Fig. 2. Data processing and statistics for cryo-EM datasets.

Left. Overview of the processing scheme for the datasets presented in this manuscript. Right. Fourier shell correlation curves calculated in Relion (black) and in Phenix (grey). One set of curves per dataset is shown. For full dataset statistics and information, see Data Table 1.
