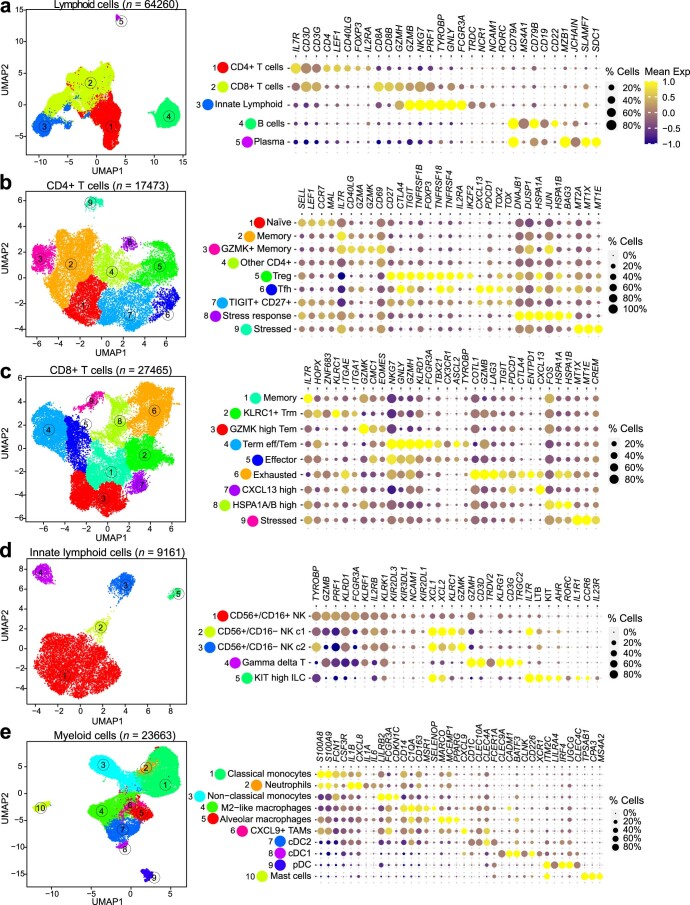
Extended Data Fig. 6. Single-cell analysis of lymphoid and myeloid cell populations in tissues from patients treated with neoadjuvant Nivo+CT and Ipi+Nivo+CT.
a, Visualization of 64,260 lymphoid cells following clustering and color-coded by lymphoid lineages (CD4+T, CD8+ T, innate lymphoid, B, and plasma). Visualization of CD4+ T (b; n = 17,473), CD8+ T (c, n = 27,465), and innate lymphoid cells (d, n = 9,161) following clustering and color-coded by sublineages. e, Visualization of 23,663 myeloid cells following clustering and color-coded by lineages. All right panels: Bubble plots showing mean expression and abundance of marker genes that are differentially expressed among lymphoid cells (a), lymphoid subsets (b-d), and myeloid (e) cells based on lineage or sublineage.

