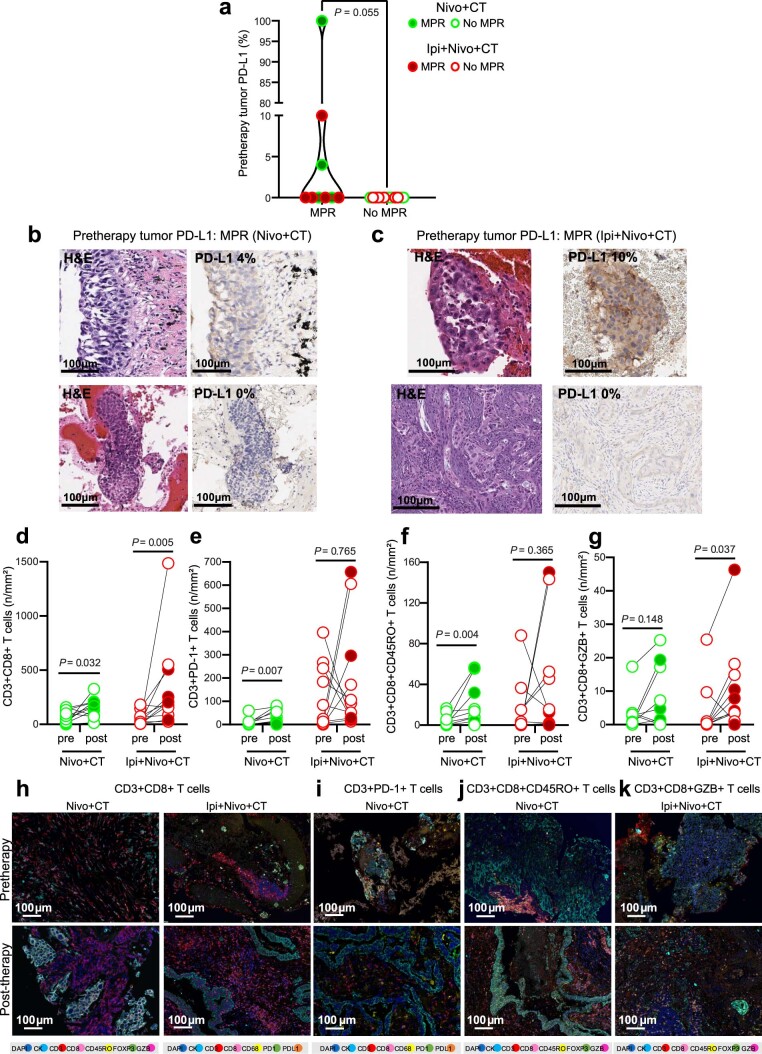
Extended Data Fig. 8. Tumor PD-L1 expression and immune population changes in tissues treated with neoadjuvant Nivo+CT and Ipi+Nivo+CT.
a, Pretherapy tumor PD-L1 IHC membranous expression (%) in malignant cells from responders and nonresponders treated with Nivo+CT and Ipi+Nivo+CT by MPR status (MPR vs. no MPR, n = 9 vs. n = 13). Data is presented as the median with minima, lower and upper quartiles, and maxima using violin plots. Individual data points are shown; the dashed line shows the median value, and dotted lines show lower quartile and upper quartile values; the top and bottom of the violin plots indicate the maxima and minima. Two-sided P value is from Wilcoxon’s rank-sum test. b, c, Examples of hematoxylin and eosin (H&E) micrographs (left panels) of pretherapy tumors from patients with MPR in Nivo+CT (b) and in Ipi+Nivo+CT (c) arms with pretherapy PD-L1 expression (right and top panel) or without PD-L1 expression (right and bottom panel) in malignant cells. Experiments and scorings related to the presented micrographs were conducted once. d-g, Quantification of CD3+CD8+ T cells (panel 1) (d), CD3+PD-1+ T cells (panel 1) (e), CD3+CD8+CD45RO+ T cells (panel 2) (f), and CD3+CD8+GZB+ T cells (panel 2) (g) densities (no. per mm2) by mIF staining in paired pretherapy and post-therapy tumor samples in Nivo+CT (n = 11) and Ipi+Nivo+CT (n = 11) groups. Two-sided P value is from Wilcoxon’s signed-rank test. h-k, Examples of micrographs of mIF staining of pretherapy and post-therapy CD3+CD8+ T cells (panel 2 and 1) (h), CD3+PD-1+ T cells (panel 1) (i), CD3+CD8+CD45RO+ T cells (panel 2) (j), and CD3+CD8+GZB+ T cells (panel 2) (k) in tumor samples in Nivo+CT and Ipi+Nivo+CT arms. Experiments and scoring related the presented micrographs were conducted once. The green filled and empty circles depict data from MPR and no MPR, respectively, in Nivo+CT patients, and the red filled and empty circles depict data from MPR and no MPR, respectively, in Ipi+Nivo+CT patients. Nivo, nivolumab; Ipi, ipilimumab; CT, chemotherapy; MPR, major pathologic response. Source data for panels a, d-g is provided as Source Data file.

