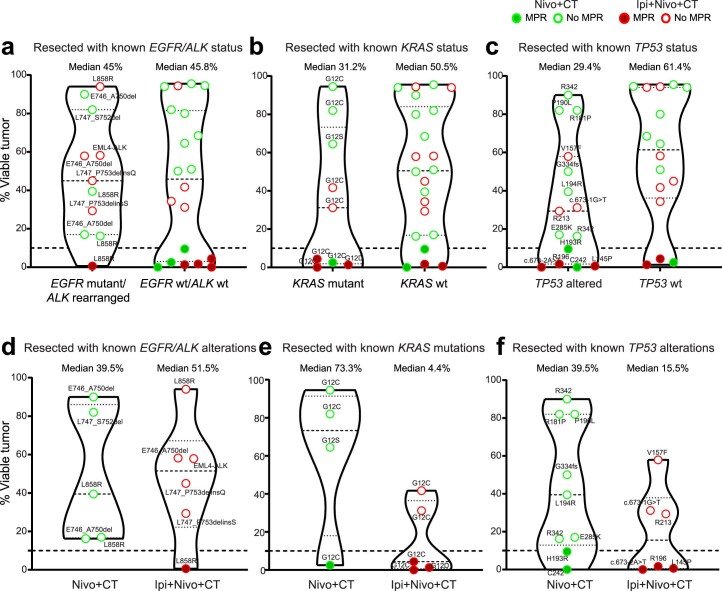
Extended Data Fig. 3. Pathological regression in resected patients with known tumor EGFR/ALK, KRAS, and TP53 alterations.
a-c, Comparison of the percentage of viable tumor in resected tumor specimens with: known EGFR mutant/ALK rearranged (n = 11) and EGFR wt/ALK wt (n = 20), median percentage of viable tumor: EGFR mutant/ALK rearranged 45% (range 0.6 – 94%), EGFR wt/ALK wt 45.8 (range 0 – 95.5%) (a); known KRAS mutant (n = 9) and KRAS wt (n = 22), median percentage of viable tumor: KRAS mutant 31.2% (range 0 – 94.5%), KRAS wt 50.5% (range 0 – 95.5%) (b); known TP53 altered (n = 15) and TP53 wt (n = 16), median percentage of viable tumor: TP53 altered 29.4% (range 0 – 90%), TP53 wt 61.4% (range 1.3 – 95.5%) (c). d-f, Percentage of viable tumor in resected tumor specimens with: known EGFR mutant/ALK rearranged tumors (Nivo+CT, n = 5; Ipi+Nivo+CT, n = 6), median percentage of viable tumor in Nivo+CT 39.5% (range 16.3 – 90%), in Ipi+Nivo+CT 51.5% (range 0.6 – 94%) (d); known KRAS mutant (Nivo+CT, n = 4; Ipi+Nivo+CT, n = 5), median percentage of viable tumor in Nivo+CT 73.3% (range 2.5 – 94.5%), in Ipi+Nivo+CT 4.4% (range 0 – 41.7%) (e); known TP53 altered (Nivo+CT, n = 9; Ipi+Nivo+CT, n = 6), median percentage of viable tumor in Nivo+CT 39.5% (range 0 – 90%), in Ipi+Nivo+CT 15.5% (range 0 – 57.9%) (f). Tumor alterations are shown as amino acid change; the splice site variants c.673-1 G>T and c.673-2A>T are shown as codon change. One patient (who had tumor TP53 alteration) was not included due to death from SARS-CoV-2 infection-related complications (non-treatment related) during neoadjuvant treatment. Dashed line at 10% point depicts cutoff for MPR. The green filled and empty circles depict data from MPR and no MPR, respectively, in Nivo+CT patients; the red filled and empty circles depict data from MPR and no MPR, respectively, in Ipi+Nivo+CT patients. Data are presented as median with minima, lower and upper quartiles, and maxima using violin plots. The dashed line indicates the median; the dotted lines indicate the lower quartile and upper quartile values; top and bottom indicate the maxima and minima. MPR, major pathologic response; Nivo, nivolumab; Ipi, ipilimumab; CT, chemotherapy; wt, wild type.

