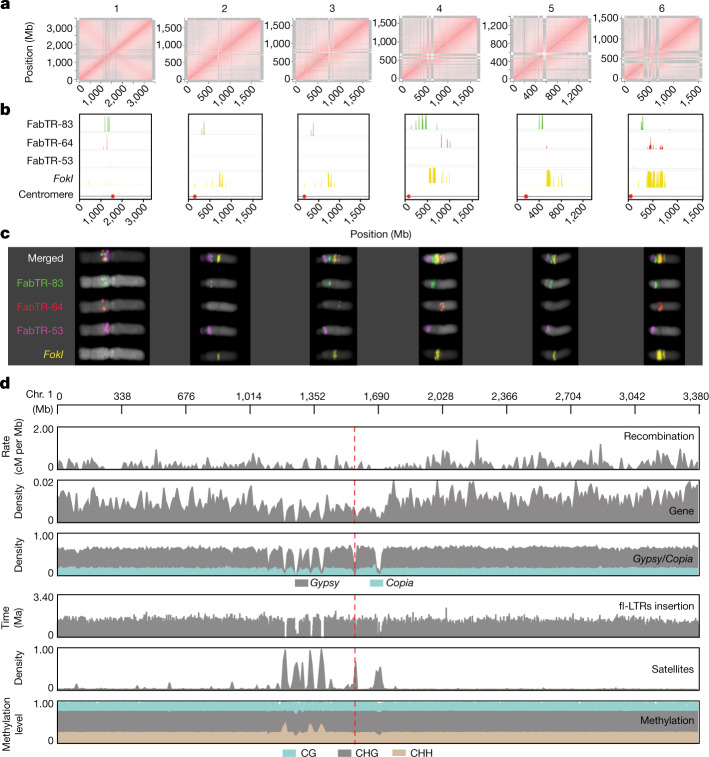
Fig. 1. Gigabase-size chromosome-scale assembly of faba bean.
a, Intrachromosomal contact matrix of assembled chromosomes. The red colour intensity indicates the normalized Omni-C Hi-C links between 1-Mb windows on each chromosome. The antidiagonal pattern in chromosome 1 represents the Rabl configuration. b, Distribution of major families of satellite repeats (FabTR-83 in green, FabTR-64 in red, FabTR-53 in magenta and FokI in yellow). c, Distribution of major families of satellite repeats on metaphase chromosomes visualized by multicolour fluorescent in situ hybridization. d, Distribution of genomic components including recombination (cM per Mb), gene density, LTR retrotransposons of Gypsy and Copia, full-length LTR-retrotransposon (fl-LTR) insertions, satellite repeats and DNA methylation (CH, CHG and CHH context) on chromosome 1. The red dashed line represents the centromere position.

