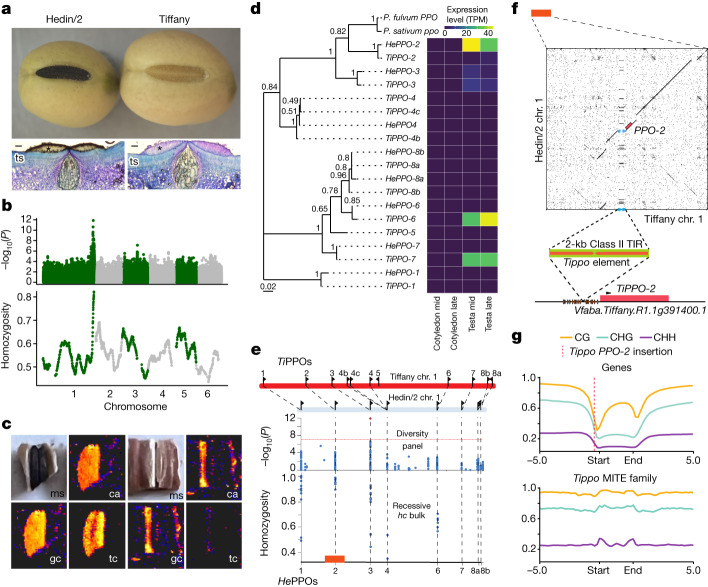
Fig. 4. Rearrangements at the complex PPO locus give rise to changes in PPO gene expression and hilum colour.
a, Whole seeds of dark hilum Hedin/2 and pale hilum Tiffany are shown above light microscope images of a transverse section (ts) of the dark (left) and pale (right) hila. Asterisks indicate the counter palisade cells of the hilum where PPO activity is indicated by brown pigmentation. Scale bars, 20 µm. b, GWAS with hilum colour scored as a binary trait in the NORFAB diversity panel (top) and for homozygosity of pale hilum parent alleles in an 84-component recessive pseudo-F2 pale hilum bulk (bottom). c, Optical image of Hedin/2 (left) and Tiffany (right) hilum specimens subjected to laser desorption–ionization mass spectrometry imaging (ms), and the laser desorption–ionization mass spectrometry imaging signal distribution for chlorogenic acid (ca), epi-gallocatechin (gc) and tetracosylcaffeate (tc), showing absence of signal from these compounds from the hilum area of the pale hilum genotype. d, Phylogenetic tree showing the relationships between the causative pea gene and 8 and 11 PPO copies found in a tandem arrangement at the Hedin/2 and Tiffany HC locus, respectively. He and Ti prefixes denote Hedin/2- and Tiffany-specific versions of PPO paralogues. The branch lengths are measured in the number of substitutions per site. Numbers next to branches indicate bootstrapping support. e, From top to bottom: to-scale schematic of the chromosome 1 PPO cluster showing the order and orientation of PPOs in Tiffany and Hedin/2, with syntenic PPO copies joined by dashed lines; close-up of hilum colour associations in the NORFAB diversity panel and homozygosity in the pale hilum (hc) bulk are also shown. The red block shows the region expanded in the dot plot in panel f. f, Dot plot of 20 kb upstream and downstream of HePPO-2 (3,291,947,464) and TiPPO-2 (3,263,562,398) showing an approximately 2-kb MITE, named ‘Tippo’, inserted in Tiffany among predicted transcription factor-binding sites (brown ovals) in close proximity to the RNA polymerase II-binding site (TATA box is shown as a green oval) and transcription start site (arrowhead) of PPO-2. TIR, Terminal inverted repeat. g, Genome-wide methylation status of genes (top) compared with the Tippo MITE family (bottom).

