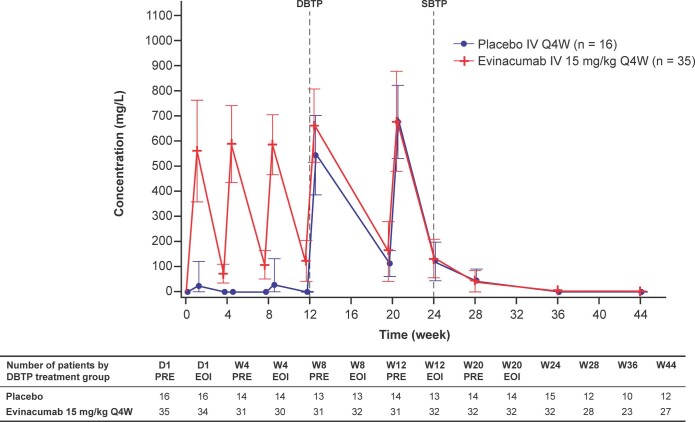
Extended Data Fig. 2. Mean (SD) of total serum evinacumab concentrations by time and treatment group.
The DBTP includes all measurements until week 12 pre-dose; the SBTP includes all measurements from week 12 EOI. During the SBTP, all patients received IV evinacumab 15 mg/kg Q4W. D, day; DBTP, double-blind treatment period; EOI, end of infusion; IV, intravenous; PRE, pre-dose; Q4W, every 4 weeks; SBTP, single-blind treatment period; SD, standard deviation; W, week.

