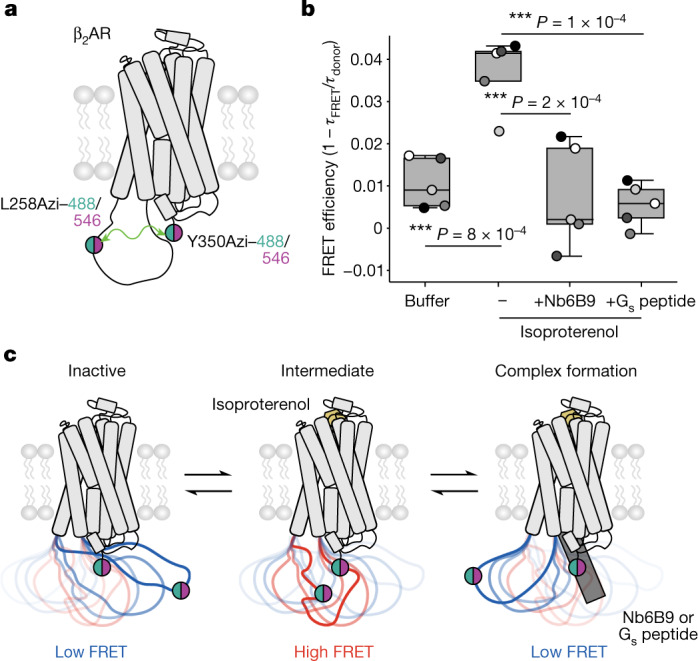
Fig. 1. Agonist- and cytoplasmic effector-binding proteins drive conformational changes in ICL3.

a, Schematic of the β2AR ICL3 FRET sensor. Membrane extracts of cells expressing β2AR(L258Azi/Y350Azi/∆351–413) were labelled with Alkyne-AZDye488 and Alkyne-AZDye546 to generate the sensor. b, FRET efficiency of untreated sensor (buffer), sensor treated with isoproterenol (100 µM), sensor treated with isoproterenol and nanobody Nb6B9 (500 nM) or sensor treated with isoproterenol and 10 µM Gs peptide (10 µM). FRET efficiency is defined as 1 − τFRET/τdonor, where τFRET is the average lifetime of the FRET sensor (Extended Data Fig. 4p, grey bars) and τdonor is the average lifetime of an AZDye488-only-labelled control sample (Extended Data Fig. 4p, white bars). Box edges delineate the 1st and 3rd quartiles of the data, the centre line represents the median, whiskers represent the furthest points within 1.5× the interquartile rangean and points represent five independent experiments. One-way ANOVA followed by Tukey’s post hoc significance test; ***P < 0.001 (F = 15.2, P = 6 × 10⁻⁶, 16 d.f.). c, Proposed sensor readout of ICL3 conformational equilibrium. Left, in the receptor’s inactive state, the donor and acceptor probes are further apart, resulting in low FRET. Centre, agonist (isoproterenol) binding increases probe proximity, thereby increasing FRET efficiency (intermediate). Right, formation of agonist–receptor–effector (with Nb6B9 or Gs peptide) complex displaces ICL3 from the intracellular cavity, extending the distance between donor and acceptor probes and quenching the FRET readout.
