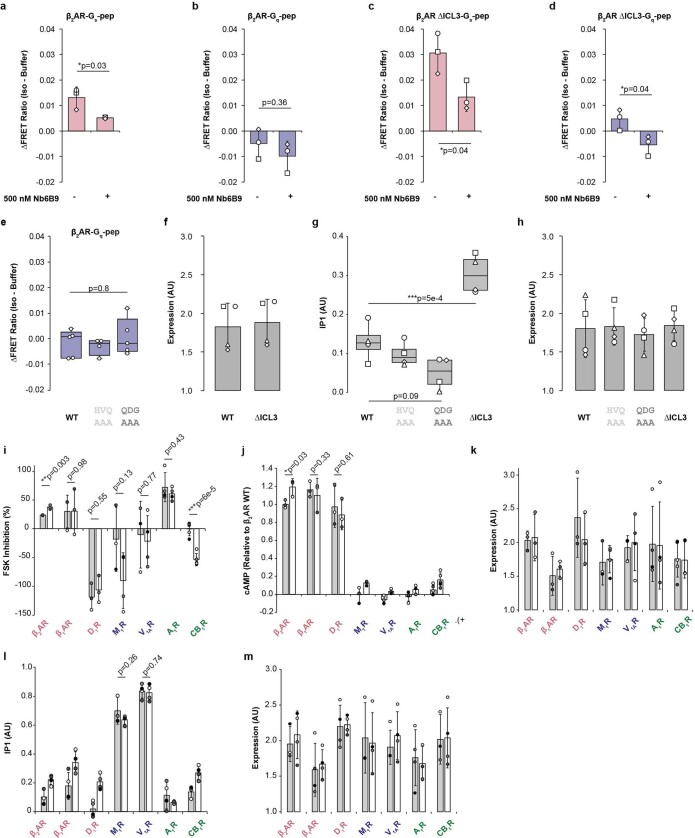
Extended Data Fig. 8. Non-cognate and secondary GPCR-G protein coupling is regulated by ICL3.
(a—d) Cognate and non-cognate G-peptides bind the receptor at the cytoplasmic cavity. The active state nanobody Nb6B9, which binds β2AR tightly at the cytoplasmic cavity, was used to quench agonist-induced changes in FRET (Isoproterenol (100 µM)-Buffer) for sensors linking β2AR to either the cognate Gs peptide (a and c) or non-cognate Gq peptide (b and d). ΔICL3 refers to truncation of ICL3 sequence as depicting in Fig. 3a. Bars represent mean ± standard deviation for 3 independent experiments, and symbols represent independent biological replicates. Statistical comparisons shown are from unpaired two-sided t-tests comparing WT and ∆ICL3, where ** indicates p < 0.01 and * indicates p < 0.05 (a: t = 3.26, b: t = 1.04, c: t = 3.06, d: t = 3.10, 4 degrees of freedom for each). (e-h) Site-directed mutations in ICL3 alone are not sufficient to alter β2AR signaling specificity. e. Agonist induced change in FRET ratio (Isoproterenol (100 µM)-Buffer) for β2AR-Gq-peptide FRET sensors. Sensors for the wild-type β2AR (WT) (n = 5 biologically independent samples), HVQ-AAA (n = 4), and QDG-AAA (n = 5) mutations in ICL3 showed no significant differences in sensor responses (F = 0.5, p = 0.6, 11 degrees of freedom). f. Expression levels of β2AR mutants in IP1 dose response curves from 4 independent experiments (Fig. 4c). g. IP1 accumulation downstream of β2AR mutants (HVQ-AAA, QDG-AAA and ICL3 truncation (ΔICL3 – Fig. 3a)) under saturating Isoproterenol (10 µM) (n = 4 independent experiments). For e and g, Box edges represent the 1st and 3rd quartiles of the data, centerline represents median, whiskers represent outlying points within 1.5x the interquartile range of the data. Symbols represent independent biological replicates. Statistical comparisons shown are from a one-way ANOVA (F = 26.02, p = 1.5e-5, 12 degrees of freedom) followed by Tukey’s post-hoc significance test where *** indicates p < 0.001. h. Expression levels of β2AR mutants in (C). For f and h, Y-axis refers to mCerulean fluorescence (ex430/em475) divided by cell-concentration dependent cell scattering (ex430/em450). Bars indicate mean ± standard deviation. Symbols denote independent experiments (n = 4). (i—m) ICL3 truncation enhances non-cognate or secondary G protein signaling. Assays were performed at saturating agonist concentrations (Supplementary Table 3). Receptor names are colored by cognate/primary G protein (red – Gs; blue – Gq; green – Gi) i. Forskolin inhibition downstream of receptor activation (Gi signaling) for Gs-coupled receptors β2AR (n = 3, t = 6.57, 4 degrees of freedom), β1AR (n = 3): t = 0.026, 4 degrees of freedom), and D1R (WT: n = 3, t = 0.64, 5 degrees of freedom); Gq-coupled receptors M1R (WT: n = 3, ∆ICL3: n = 4 t = −1.83, 5 degrees of freedom) and V1AR (WT: n = 3, ∆ICL3: n = 4, t = −0.3, 5 degrees of freedom); and Gi-coupled receptors A1R (n = 4, t = −0.83, 6 degrees of freedom) and CB1R (n = 4, t = −7.54, 8 degrees of freedom) j. cAMP accumulation following receptor activation (Gs signaling) for Gs-coupled receptors β2AR (n = 3, t = 3.24, 4 degrees of freedom), β1AR (WT: n = 3, ∆ICl3: n = 4, t = −1.07, 5 degrees of freedom), D1R (n = 3, t = −0.55, 4 degrees of freedom); Gi-coupled receptors A1R (n = 3) and CB1R (n = 5); and Gq-coupled receptors M1R (WT: n = 3, ∆ICL3: n = 4)) and V1AR (WT: n = 3, ∆ICL3: n = 4). k. Corresponding expression level of wild-type receptors (WT, grey bars) and receptor ICL3 truncation mutants (∆ICL3, white bars) for (i) Forskolin inhibition and (j) cAMP accumulation. l. IP1 accumulation following receptor activation (Gq signaling) for Gs-coupled receptors β1AR (n = 4), β2AR (WT: n = 3, ∆ICL3: n = 4), and D1R (n = 4); Gq-coupled receptors M1R (WT: n = 3, ∆ICL3: n = 4, t = −1.26, 5 degrees of freedom) and V1AR (n = 4, t = −0.35, 6 degrees of freedom); and Gi-coupled receptors A1R (n = 3) and CB1R (WT: n = 3, ∆ICL3: n = 4). m. Corresponding expression level of wild-type receptors (WT, grey bars) and receptor ICL3 truncation mutants (∆ICL3, white bars) for (l) IP1 accumulation. Statistical comparisons shown in (I,j and l) are from unpaired t-tests comparing WT and ∆ICL3, where *** indicates p < 0.001, ** indicates p < 0.01 and * indicates p < 0.05. Bars represent mean ± standard deviation of n biological samples (i) and (j). Shaded circles represent independent experiments.

