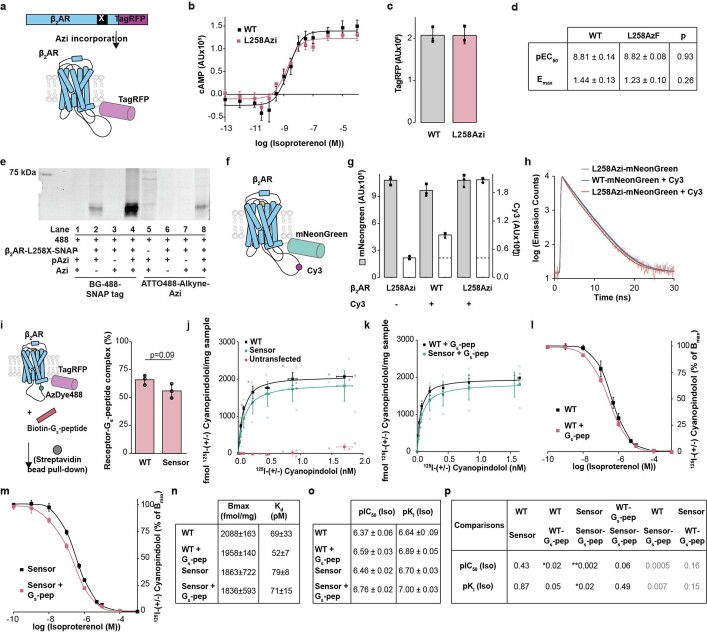
Extended Data Fig. 3. Pharmacological and biochemical characterization of L258Azi incorporation and bio-orthogonal click chemistry.
a. Schematic of stop codon suppression. L258 in the ICL3 of C-terminally truncated β2AR (Δ350-413)-TagRFP is mutagenized to an amber stop codon (TAG). 4-azido-L-phenylalanine (Azi) is incorporated by charging amber suppressor tRNACUA with Azi using an engineered synthetase specific for Azi20. b. Isoproterenol dose - cAMP accumulation response for overexpressed β2AR-(Δ350-413)-TagRFP constructs. Points are mean ± standard error of mean of three biological replicates. Curves are the fit of the mean data (Methods). c. Expression levels of constructs in (b) as measured by TagRFP fluorescence at equivalent cell counts. Bars indicate mean ± standard deviation, points represent three independent experiments. d. Table of fit parameters from (b). Values indicate mean ± standard error of mean of three independent experiments. Statistical comparisons shown are from unpaired two-sided t-tests comparing WT and L258 Azi (pEC50: t = −0.09, 4 degrees of freedom; Emax: t = −1.33, 4 degrees of freedom). e. Fluorescence gel scanning (ex 473 nm, 510- long pass emission scan; complete gel scan is included in Supplementary Fig. 1) Lanes 1-4 (numbered left to right; left half of gel) - incorporation of Azi into β2AR L258x (Δ350-413) SNAP (β2AR-L258X-SNAP), measured by detection with SNAP Surface Block 488 (BG-488) (Expected molecular weight 60 kDa). Deviations in expected vs apparent molecular weight have been previously reported in helical membrane proteins67. Membrane extracts from cells transfected without (−) and with (+) the vector containing the receptor mutant (Lane 1 vs 4); transfected +/− the vector containing the amber suppressor tRNACUA and Azi tRNA Synthetase (pAzi) (Lane 3 vs 4); and incubated +/− 0.5 mM of the unnatural amino acid Azi (Azi) (Lane 2 vs 4). Highest band intensity is seen when all components are present. A band of lighter intensity is seen in the absence of Azi (lane 2), which are likely attributable to charging of tRNACUA by the Azi tRNA synthetase with other amino acids under our transfection conditions. Lanes 5-8 (right half of gel), click-chemistry labeling of β2AR L258Azi (Δ350-413) SNAP with ATTO488-Alkyne (equivalent fluorophore to BG-488) using the same controls as lanes 1-4. Highest band intensity is seen when all components are present. Non-specific bands are seen in the absence of receptor mutant, which is attributable to labeling of Azi-suppressed amber stop codons of endogenous proteins (23% of open reading frames in the Human genome have TAG stop codons68) with ATTO488-Alkyne. Lighter intensity of lane 8 band compared to lane 4 band is likely due to incomplete labeling with ATTO488-Alkyne, which could reduce apparent basal FRET. Experiment for which scan was collected was performed in parallel three times. f. Schematic of β2AR L258Azi (Δ350-413) mNeonGreen, with L258Azi labeled with Cy3-Alkyne. g. Labeling specificity of construct depicted in (f). Grey bars, mNeonGreen fluorescence (ex470/em515). White bars, Cy3 fluorescence (ex535/em565). Bars represent mean ± standard deviation of three independent experiments. Dotted line on Cy3 bars represents mNeonGreen cross-excitation (β2AR L258Azi (Δ350-413) mNeonGreen without Cy3). With this considered, the labeling conditions yield a ~3:1 signal (β2AR L258Azi (Δ350-413) mNeonGreen with Cy3-Alkyne) to noise (β2AR wild-type (WT) (Δ350-413) mNeonGreen with Cy3) ratio, which could also diminish apparent basal FRET h. Representative mNeonGreen fluorescence decay curves of the labeling conditions in (g). Only the specific labeling condition results in an observable left-shift in fluorescence decay. i. Receptor-Gs peptide complex formation. Left, schematic of Gs-peptide pulldown assay used to assess complex formation. Membrane extracts of cells containing β2AR (Δ350-413)-TagRFP are pulled down onto streptavidin-coated magnetic beads via 30 μM of N-terminally Biotinylated Gs-peptide. Right, Biotin-Gs-peptide pulldown measurements comparing β2AR Δ350-413 TagRFP (WT) and β2AR L258Azi Δ350-413 TagRFP labeled with AZDye488 (Sensor). Bars represent mean ± standard deviation of 3 independent experiments. Points represent experimental replicates. Statistical comparison shown is from an unpaired two-sided t-test (t = 2.28, 4 degrees of freedom). j. 125I-(+/−)-Cyanopindolol binding to membrane extracts of WT, sensor, and endogenous adrenergic receptors (Untransfected). k. 125I-(+/−)-Cyanopindolol binding to membrane extracts of WT and Sensor in the presence of 30 μM Gs-peptide. l. Competition binding between 125I-(+/−)-Cyanopindolol and Isoproterenol for WT and m. Sensor. Binding assays in l were performed in the presence and absence of 30 μM Gs-peptide. For (j—m), opaque points represent the mean ± standard error of mean of 3 independent experiments. Curves represent the fit of the mean data to a binding model (see Methods). For (j) and (k), transparent points represent experimental replicates. n. Table of fit parameters from 125I-(+/−)-Cyanopindolol binding assays in (j) and (k) and o. competition binding assays in (l) and (m) (mean ± standard error of mean of three independent experiments). p. Table of p-values from post-hoc statistical comparisons. Comparisons shown are from two-way ANOVA followed by Tukey’s post-hoc significance test where ** indicates p < 0.01 and * indicates p < 0.05 (pIC50: Factor 1 (WT vs Sensor): F = 11.1, p = 0.01, Factor 2 (Gs-peptide treatment): F = 44.5, p = 2e-4, Factor 1* Factor 2: F = 1.2, p = 0.3; pKi: Factor 1: F = 2.5, p = 0.2, Factor 2: F = 25.3, p = 1e-3, Factor 1* Factor 2: F = 0.3, p = 0.6). Grey indicates an insignificant interaction from ANOVA (p ≥ 0.05).

