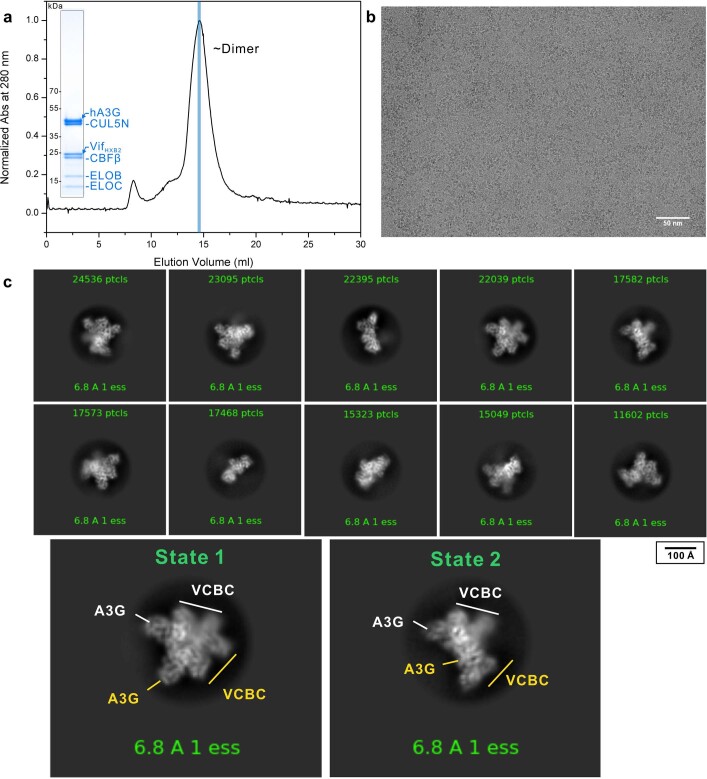
Extended Data Fig. 1. A3G–VCBC–CUL5N complex expression, purification, and characterization.
a, Size exclusion chromatograph of purified A3G–VCBC–CUL5N complex along with a coomassie blue-stained SDS-PAGE (insert) of peak fraction (blue bar). The gel is representative of three independent experiments. For source gel data, see Supplementary Fig. 1b. b, A representative motion-corrected cryo-EM micrograph of purified complexes collected from peak fraction (blue bar in (a)) imaged on UltraAuFoil grid. Scale bar, 50 nm. c, Selected 2D class averages used for generating ab initio model in the first round of heterogeneous refinement (Extended Data Fig. 2a). Similar class averages were obtained from three independent preparations imaged on Quantifoil Gold grids. Scale bar, 100 Å. Shown at the bottom are expanded views of the fourth and fifth 2D classes with two copies of A3G-VCBC labeled in white and yellow.

