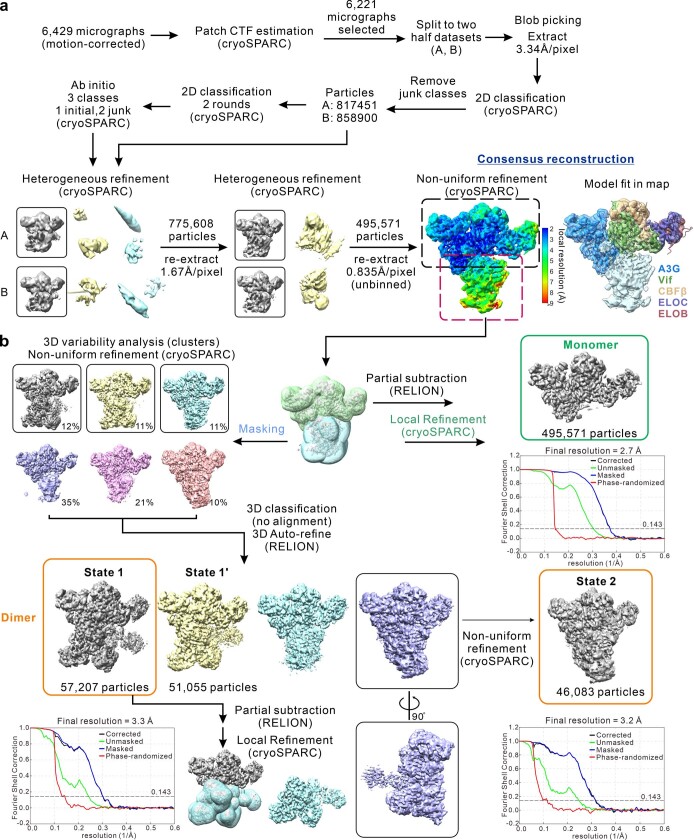
Extended Data Fig. 2. Workflow of cryo-EM image processing.
Flowchart of pre-processing, classification, and refinement used to generate a, the consensus reconstruction map (monomer) and b, final maps (dimers) for model building. See Methods for details. Black boxes indicate the selected classes and corresponding particles used in the further refinement. The consensus reconstruction is colored according to the local resolution estimated by ResMap73. Shown on the right are the A3G and VCBC structures fit in the consensus map that is colored by subunits. Masks were used to determine different regions of volume for focused refinement and 3D variability analysis in cryoSPARC. Green and orange boxes indicate the final reconstruction for monomer and dimers, respectively; their corresponding Gold-Standard Fourier Shell Correlation (GSFSC) curves are shown at the bottom. The nominal resolution of the final map for monomer, State 1, and State 2 dimer is 2.7, 3.3, and 3.2 Å, respectively.

