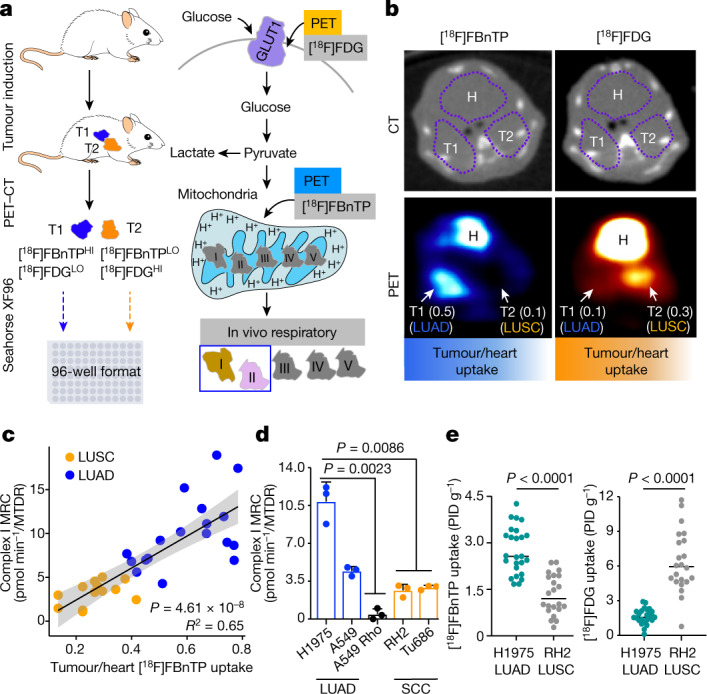
Fig. 1. In vivo characterization of mitochondrial bioenergetics and respiration capacity among NSCLC subtypes.

a, Schematic depicting experimental approach of [18F]FBnTP and [18F]FDG PET imaging followed by respirometry on frozen tumour samples measuring mitochondrial complex I and complex II MRC. T1, tumour 1; T2, tumour 2. b, Representative [18F]FBnTP (left) and [18F]FDG (right) transverse PET–CT images of KPL mice. Uptake of PET probe was measured as the maximum percentage of injected dose (PID) per gram of tissue. Numbers in brackets after T1 and T2 indicate ratio of uptake tumour to heart. H, heart. c, Correlation between the tumour/heart ratio of [18F]FBnTP uptake and complex I MRC of tumours from KPL, KL, Kras, KP and LPP mice (n = 30 tumours, n = 18 LUAD tumours and n = 12 LUSC tumours). The MRC values are normalized to mitochondrial content quantified by MitoTracker Deep Red (MTDR). The grey shading represents s.e.m. One-tailed F-statistics. d, MRC of complex I in frozen xenografts from human cells (H1975, A549, A549 Rho, RH2 and Tu686); data are mean ± s.e.m. (n = 3 biological replicates per cell line). One-way analysis of variance (ANOVA), Dunnett test. e, [18F]FBnTP (n = 25 LUAD tumours, n = 22 LUSC tumours) and [18F]FDG (n = 22 LUAD tumours, n = 22 LUSC tumours) uptake of xenografts from human NSCLC cell lines (H1975 and RH2). Unpaired two-tailed t-test, lines indicate mean value.
