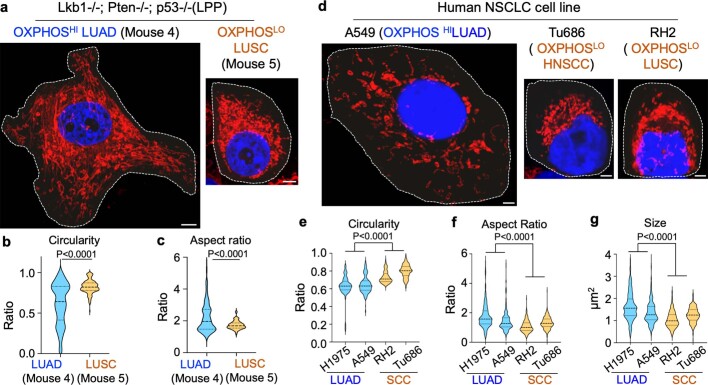
Extended Data Fig. 7. Morphological analysis of mitochondrial networks in mouse and human NSCLC cells cultured in vitro.
a, Representative confocal Airyscan images stained with Mitotracker deep red (MTDR, red) and Hoechst (blue) of mouse NSCLC cells derived from OXPHOSHI LUAD (mouse 4, LPP) and OXPHOSLO LUSC (mouse 5, LPP). Scale bar = 5 μm. b,c, Violin plots showing mitochondrial morphological descriptors (circularity and aspect ratio) in mouse LUAD and LUSC cells, n > 150 cells per cell line, 3 biological replicates; unpaired two-tailed t-test. d, Representative confocal Airyscan images stained with MTDR (red) and Hoechst (blue) of human OXPHOSHI LUAD (H1975, A549) and OXPHOSLO SCC (RH2, Tu686) cell lines. Scale bar = 4 μm. e–g, Violin plots of mitochondrial morphological descriptors (circularity and aspect ratio) and mitochondrial size (area) in human LUAD cell lines (H1975, A549) and SCC cell lines (RH2, Tu686). Data are from n = 3 biological replicates, n > 240 cells per cell line, unpaired two-tailed t-test.

