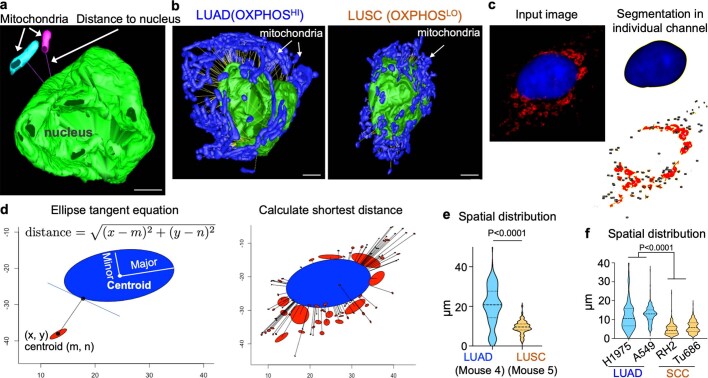
Extended Data Fig. 8. Spatial analysis of mitochondrial networks in mouse and human NSCLC cells cultured in vitro.
a, Illustration of the distance between nucleus and mitochondrial meshed surface using mtk program in Imod. Scale bar = 5 μm. b, Mitochondrial spatial distribution was relative to nucleus and measured by the distance between individual mitochondria to the surface of corresponding nucleus in OXPHOSHI LUAD (left panel) and OXPHOSLO LUSC (right panel) cells imaged by SBEM. Scale bar = 3 μm. c,d, Schematic of the method developed for measuring the distance between nucleus and mitochondria in 2D confocal Airyscan images. Nucleus and mitochondria are segmented in ImageJ and reconstructed in ellipse shape with the parameters of centroid coordinates, major and minor axes, and angle. The shortest distance between mitochondrial centroid and nucleus ellipse equation is estimated by solving the Lagrangian function. e,f, Violin plots of the spatial distribution of mitochondria network in mouse (e) and human (f) OXPHOSHI LUAD and OXPHOSLO LUSC/SCC cells. Data are from n = 3 biological replicates, n > 150 cells per cell line (e), n > 240 cells per cell line (f), unpaired two-tailed t-test.

