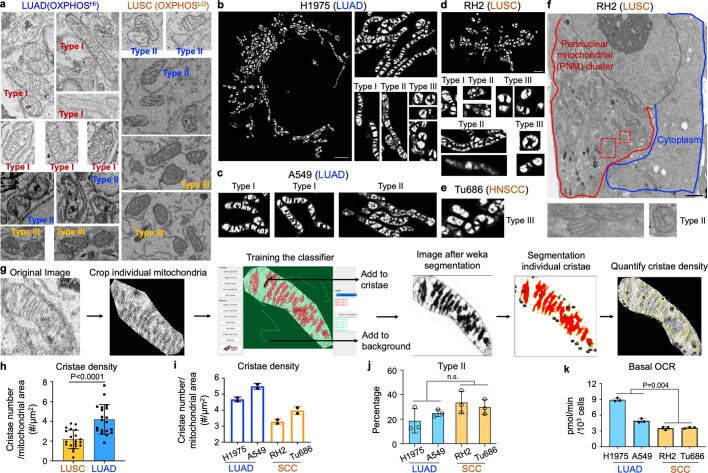
Extended Data Fig. 9. Mitochondrial cristae types in mouse and human NSCLC cells imaged by SBEM and confocal Airyscan.
a, Representative of mitochondrial cristae structure in SBEM images of OXPHOSHI LUAD (left panel) and OXPHOSLO LUSC (right panel). The classification of type I, II and III cristae was indicated in the representative images. b–e, Representative of mitochondrial cristae structure of OXPHOSHI LUAD (b,c) and OXPHOSLO LUSC (d,e) cells imaged by confocal Airyscan and processed by WEKA segmentation (ImageJ). The classification of type I, II and III cristae was indicated in the representative images. Scale bar (b) = 3 μm. Scale bar (d) = 2 μm. f, Transmitted electron microscopy (TEM) image of OXPHOSLO LUSC (RH2) cell. Zoomed-in images from red boxes illustrated type II cristae structure. Scale bar = 3 μm. g, Workflow of mitochondrial cristae segmentation and quantification in SBEM images by trainable WEKA segmentation (ImageJ). h, Mitochondrial cristae density (cristae number/mitochondrial area) in OXPHOSHI LUAD and OXPHOSLO LUSC cells imaged by SBEM (n = 20 mitochondria per tumor type). Data are mean ± s.e.m., unpaired two-tailed t-test. i, Mitochondrial cristae density (cristae number/mitochondrial area) in human OXPHOSHI LUAD (H1975, A549) and OXPHOSLO SCC (RH2, Tu686) cells. Data are mean ± s.e.m. (n = 2 biological replicates, >100 cells per cell line). j, Percentage of type II cristae distribution in human LUAD (H1975, A549) and SCC (RH2, Tu686) cells. Data are mean ± s.e.m. (n = 3 biological replicates, n > 2,000 mitochondria). Unpaired two-tailed t-test. k, Basal OCR of in human OXPHOSHI LUAD (H1975, A549) and OXPHOSLO SCC (RH2, Tu686) cells. Data are mean ± s.e.m. (n = 3 biological replicates). Unpaired two-tailed t-test.

