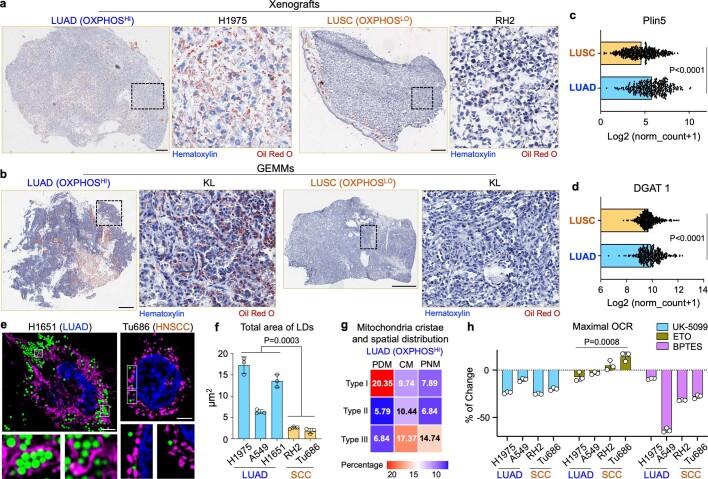
Extended Data Fig. 10. Differential accumulation of lipid droplets (LDs) between OXPHOSHI LUAD and OXPHOSLO SCC.
a,b, Co-staining of oil red o and hematoxylin in OXPHOSHI LUAD and OXPHOSLO LUSC tumors from xenografts of human cells (a: H1975, RH2) and GEMMs (b: KL). Scale bar = 400 μm. c,d, The expression levels of Plin5 and DGAT1 in LUAD and LUSC tumors from The Cancer Genome Atlas (TCGA) analysis (n = 364 LUAD cells, n = 527 LUSC cells). Unpaired two-tailed t-test. e, Representative confocal Airyscan images stained with MitoTracker DeepRed (MTDR, purple), bodipy (green) and Hoechst (blue) in cultured human LUAD (H1651) and HNSCC (Tu686) cells. Scale bar = 5 μm. f, Quantification of total area of LDs per cell in human LUAD and SCC cells. Data are mean ± s.e.m. (n = 3 biological replicates, n > 300 cells per cell line). Unpaired two-tailed t-test. g, Heat map showing the percentage of mitochondrial population classified by both spatial distribution and cristae types in OXPHOSHI LUAD cells. Data are mean value from n = 3 biological replicates (n > 1,200 mitochondria). h, Percentage of change in maximal OCR of human LUAD and SCC cells in response to UK-5099, ETO and BPTES. Data are mean ± s.e.m. (n = 3 biological replicates), unpaired two-tailed t-test.

