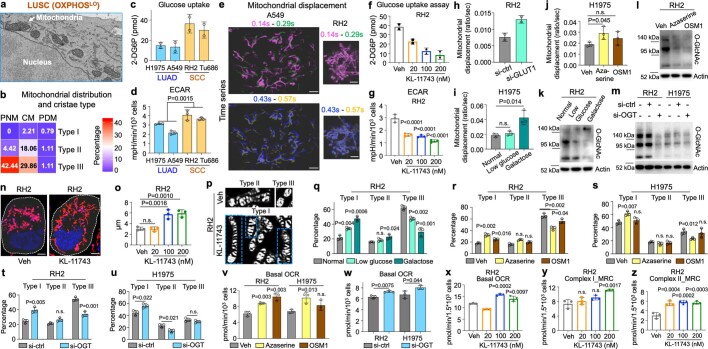
Extended Data Fig. 11. Glycolytic LUSC cells rescue OXPHOS activity by glucose restriction and inhibition of hexosamine pathway.
Data are mean ± s.e.m. (n = 3 biological replicates), unpaired two-tailed t-test unless specified. a, Representative 2D SBEM image showing PNM and associated type III cristae in OXPHOSLO and glycolytic LUSC. b, Heat map showing the percentage of mitochondrial population classified by both spatial distribution and cristae types in OXPHOSLO LUSC cells. Data are mean value from n = 3 biological replicates (n > 750 mitochondria). c,d, Colorimetric assay measuring glucose uptake (c) and ECAR rate (d) in human LUAD (H1975, A549) and SCC (RH2, Tu686) cells. (c) n = 2 biological replicates. e, Representative of mitochondrial displacement by overlaying images from different time points in OXPHOSHI LUAD (A549) and OXPHOSLO LUSC (RH2) cells. Scale bar = 3 μm. f,g, Colorimetric assay measuring glucose uptake (f) and ECAR rate (g) in RH2 cells treated with vehicle (Veh) or KL-11743 with indicated concentrations for 72 h. (f) n = 2 biological replicates. (g) One-way ANOVA, Dunnett test. h, Mitochondrial displacement in RH2 cells treated with si-ctrl and si-GLUT1 for 72 h (n = 2 biological replicates, n > 60 per treating condition). i,j, Mitochondrial displacement in H1975 cells treated with low glucose (5.5 mM) and galactose medium for 24 h (i), hexosamine pathway inhibitors azaserine (0.5 μM) and OSM1 (25 μM) for 72 h (j). n > 100 per treating condition. k–m, Western blots were probed with indicated antibodies on lysates of RH2 cells treated with low glucose (5.5 mM) and galactose medium for 24 h (k), hexosamine pathway inhibitors azaserine (0.5 μM) and OSM1 (25 μM) for 72 h (l), and on lysates of RH2 and H1975 cells treated with si-ctrl and si-OGT for 72 h (m). n, Representative of confocal Airyscan imaged RH2 cells stained with MTDR (red) and Hoechst (blue) of after treatment of vehicle (Veh) or KL-11743 (200 nM) for 72 h, scale bar = 4 μm. o, Quantification of the spatial distribution of mitochondrial network in RH2 cells treated with Veh or KL-11743 with indicated concentrations. n = 300 cells per treating condition. One-way ANOVA, Dunnett test. p, Representative of confocal Airyscan imaged cristae structure (type I, II and III) in RH2 cells treated with Veh or KL-11743 (200 nM, 72 h) and stained with 10-N-nonyl acridine orange (NAO) and followed by Weka segmentation (ImageJ). q–u, Percentage of type I, II, III cristae in RH2 and H1975 cells treated with low glucose (5.5 mM) and galactose medium for 24 h (q), hexosamine pathway inhibitors azaserine (0.5 μM) and OSM1 (25 μM) for 72 h (r,s) and si-ctrl and si-OGT for 72 h (t,u). n > 600 mitochondria per treating condition. v,w, Mitochondrial basal OCR in RH2 and H1975 cells treated with hexosamine pathway inhibitors azaserine (0.5 μM) and OSM1 (25 μM) for 72 h (v) and si-ctrl and si-OGT for 72 h (w). x–z, Mitochondrial basal OCR (x) and Complex I (y) and Complex II (z) MRC in RH2 cells treated with indicated concentrations of KL-11743 for 72 h. One-way ANOVA, Dunnett test.

