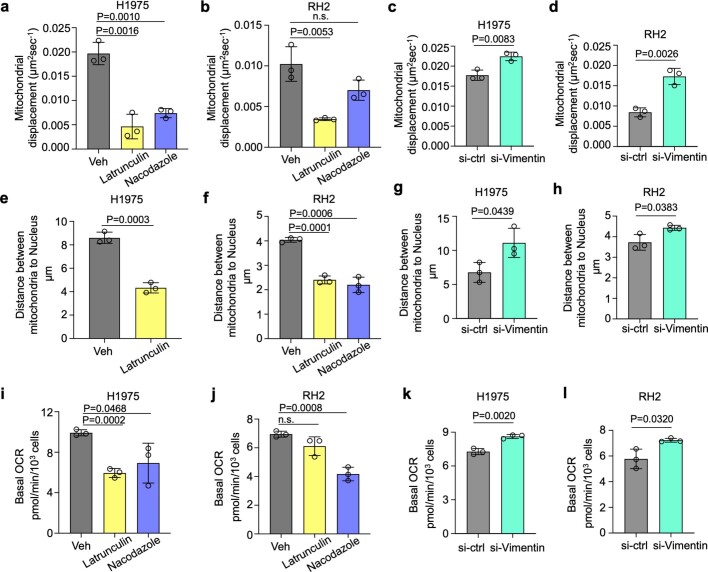
Extended Data Fig. 12. Mitochondrial motility, spatial distribution and respiration in OXPHOSHI LUAD and OXPHOSLO LUSC cells treated with the cytoskeleton disruptors.
Data are mean ± s.e.m. (n = 3 biological replicates), unpaired two-tailed t-test unless specified. a-d, Mitochondrial displacement in H1975 (a,c) and RH2 (b,d) cells treated with latrunculin A (1 μM) and nocodazole (6.7 μM) for 12 h (a,b), and treated with si-ctrl and si-Vimentin for 72 h (c,d). n > 90 cells per treating condition. e-h, Quantification of the spatial distribution of mitochondrial network in H1975 (e,g) and RH2 (f,h) cells treated with latrunculin A (1 μM) and nocodazole (6.7 μM) for 12 h (e,f), and treated with si-ctrl and si-Vimentin for 72 h (g,h). n > 150 cells per treating condition. i–l, Mitochondrial basal OCR in H1975 (i,k) and RH2 (j,l) cells treated with latrunculin A (1 μM) and nocodazole (6.7 μM) for 12 h (i,j), and treated with si-ctrl and si-Vimentin for 72 h (k,l).

