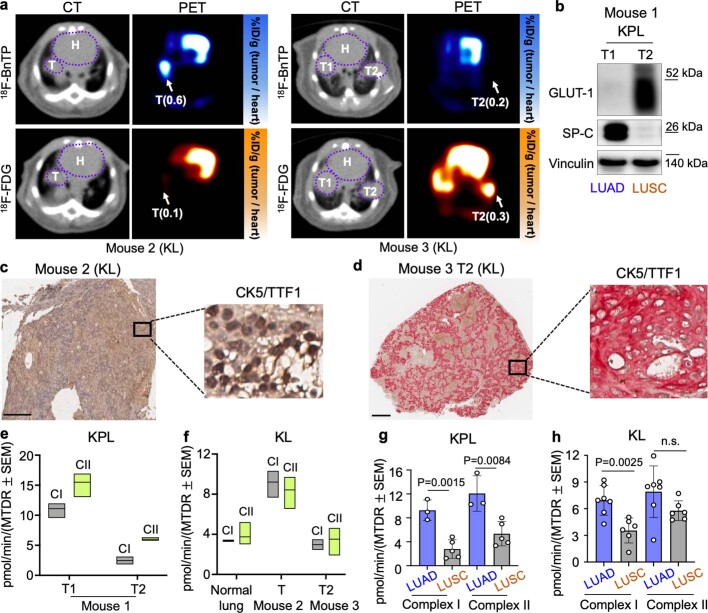
Extended Data Fig. 1. PET/CT imaging, histology and respirometry analysis on KrasG12D/+ and Lkb1−/− driven tumors.
a, Representative transverse images of PET/CT probed with 18F-BnTP (top) and 18F-FDG (bottom) in KrasG12D/+; Lkb1−/− (KL) mice. Uptake of PET probe was measured by the maximum percentage of inject dose per gram (%ID/g). Ratio of %ID/g by tumor to %ID/g by heart is labeled as %ID/g (tumor/heart). H-heart, T-tumor. b, Whole cell lysates of lung tumors T1 and T2 isolated from KrasG12D/+; Lkb1−/−; p53−/− (KPL) mouse were immunoblotted with the antibodies of GLUT1 and SP-C. c,d, Immunohistochemical staining of TTF-1 and CK-5 in sections from 18F-BnTPHI tumor (mouse 2, left panel) and 18F-BnTPLO tumor (T2 in mouse 3, right panel). Scale bar = 500 μm. e,f, Maximal respiration capacity (MRC) of mitochondrial Complex I (CI) and Complex II (CII) isolated from frozen tissues of T1 and T2 in mouse 1 (KPL) (e) and from T in mouse 2 (KL) and T2 in mouse 3 (KL) (f). Data are n = 3 technical replicates, box was interleaved low-high, line at mean. g,h, MRC of Complex I and Complex II in LUAD and LUSC from KPL mice (n = 8 tumors, 3 LUAD tumors and 5 LUSC tumors) (g) and from KL mice (n = 13 tumors, 7 LUAD tumors and 6 LUSC tumors) (h). Data are mean ± s.e.m., unpaired two-tailed t-test.

