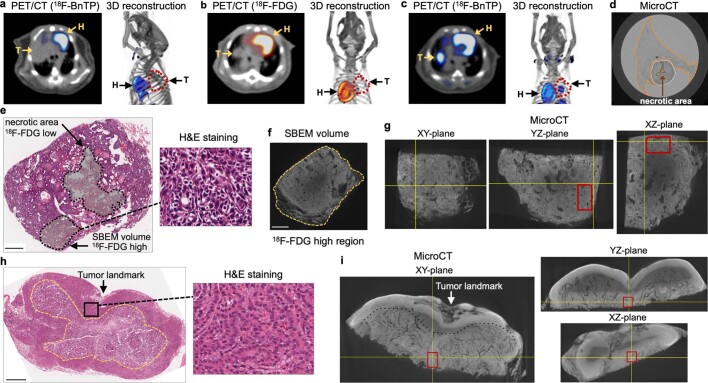
Extended Data Fig. 3. PET guided microCT analysis to select regions for SBEM imaging.
a,b,c, Transverse view and 3D reconstruction of PET/CT overlayed images probed with 18F-BnTP (a,c) and 18F-FDG (b) of 18F-FDGHI LUSC tumor in Fig. 2b (a) and 18F-BnTPHI LUAD tumor (b,c). d, MicroCT image showed the position of tumor (white outlined) in the lung lobe (orange outlined). Dense tumor region is distinguished from tissue sparse necrotic area (brown outlined) by tissue density. e,h, Hematoxylin and eosin (H&E) staining of sections from OXPHOSLO LUSC tumor (e) and OXPHOSHI LUAD tumor (h). Scale bar = 500 μm. (e) Arrows indicated necrotic area and selected region for SBEM imaging in OXPHOSLO LUSC tumor. (h) Arrow indicated the tumor landmark, box indicated selected region for SBEM imaging in OXPHOSHI LUAD tumor. f, High-resolution microCT image of selected SBEM region with high 18F-FDG signal and dense tumor tissue indicated in (e). Scale bar = 200 μm. g,i, Cross-sections of XY, YZ and XZ planes in 3D rendered microCT images on heavy-metal stained OXPHOSLO LUSC tumor (g) and OXPHOSHI LUAD tumor (i). Selected regions for SBEM imaging were indicated in the red boxes.

