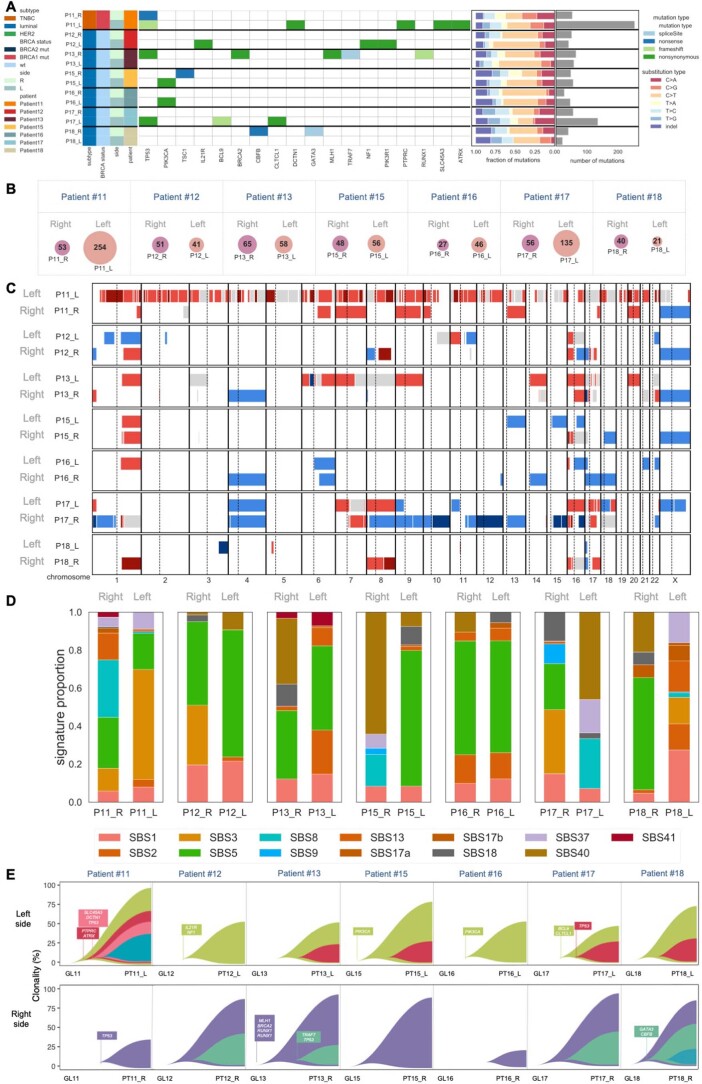
Extended Data Fig. 6. Genomic profiles of 14 tumors from 7 pairs of sBBCs in an in-house independent validation cohort of patients treated by surgery as first treatment.
A. Tumor mutation profiles: Heatmap of somatic driver mutations (including missense, nonsense, and splicing); B. Venn diagrams showing the number of mutations shared between the left (pink) and the right (purple) primary tumors of a same patient; C: Copy number alterations (CNA); D: Mutational signatures profiles as published by Alexandrov25 are calculated using the deconstructSigs package.; E: Fishplots retracing phylogeny between left, right primary tumors. Abbreviations: L, left; R, right; RD, TNBC, triple negative breast cancer.

