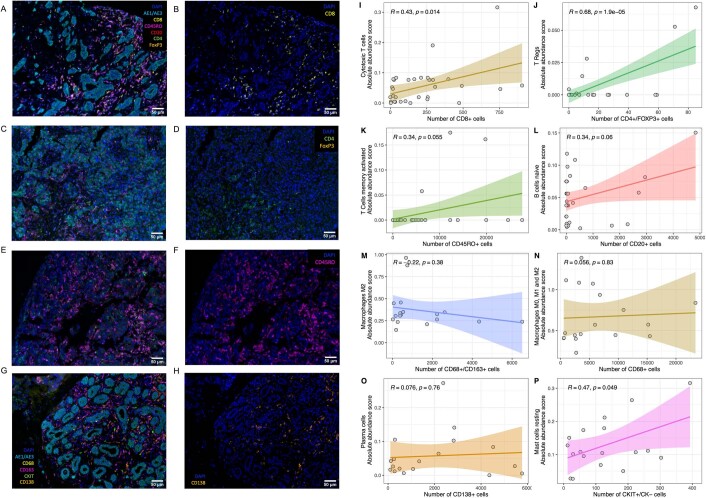
Extended Data Fig. 7. Multiplex immunofluorescence (IF) images and their correlation with abundance of the immune subset inferred by CIBERSORT.
The stainings were performed in the in left, right, pre and post-NAC samples of a cohort of 6 patients (20 samples). The images A to H show the same regions of tumors stained with the whole panel (left facet) and focusing on an antibody (right facet). Markers of the panel #1 (Figures A to F) include - CD4 – CD8 – CD45RO – FOXP3 – CD20 – AE1/AE3, and markers of the panel #2 (Figures G-H) include CD68 – CD 163 – CD138 – CKIT – AE1/AE3. We used the total number of stained cells for an antibody to perform the correlation with immune subsets inferred by the deconvolution, with the following correspondence: CD8 + cells: Cytotoxic T cells; CD4 + /FOXP3 + cells: T regs; CD45RO + cells: T cells memory activated; CD20 + cells: B cells naïve; CD68 + /CD163 + cells: Macrophages M2; CD68 + cells: Macrophages M0,M1, and M2; CD138 + cells: Plasma cells. Image size is 0.67 mm×0.5 mm, and resolution is 0.4999 μm /pixel (x20). The two RD samples could not be assessed in patient #3 due to material exhaustion. Sample of primary tumor in patient #6 right tumor (tumor A) stained with the whole panel #1; B. with a highlight on CD8 + cells; C. Sample of primary tumor in patient #5 left. tumor stained with the whole panel #1; D. with a highlight on CD4 + /FOXP3 + cells; E. Sample of primary tumor in patient #2 right tumor stained with the whole panel #1; F. highlight on CD45RO + cells; G. Sample of primary tumor in patient #4 right tumor stained with the whole panel #2; H. with a highlight on CD138 + cells. Spearman correlation coefficient between the number of stained cells with one antibody, and the proportion of the corresponding immune subtype as inferred by deconvolution applied to the gene expression data; I:Absolute abundance score of cytotoxic T cells by number of CD8 + cells; J: Absolute abundance score of T Regs cells by number of CD4 + /FOXP3 + cells; K: Absolute abundance score of Memory T cells by number of CD45RO + cells; L: Absolute abundance score of B cells naïve by number of CD20 + cells; M: Absolute abundance score of Macrophages M2 by number of CD68 + /CD163 + cells; N: Absolute abundance score of Macrophages M0,M1, and M2 by number of CD68 + cells; O: Absolute abundance score of plasma cells by number of CD138 + cells; P: Absolute abundance score of Mast cells resting by number of cKIT + /CK- cells. Statistical tests were Pearson correlation coefficients (Extended Data Fig. 7I-P). The lines represent the fitted linear regression line and the colored bands represent the 95% confidence interval bands. The staining was performed once for every case. White scale (bottom right) represents 50 µm.

