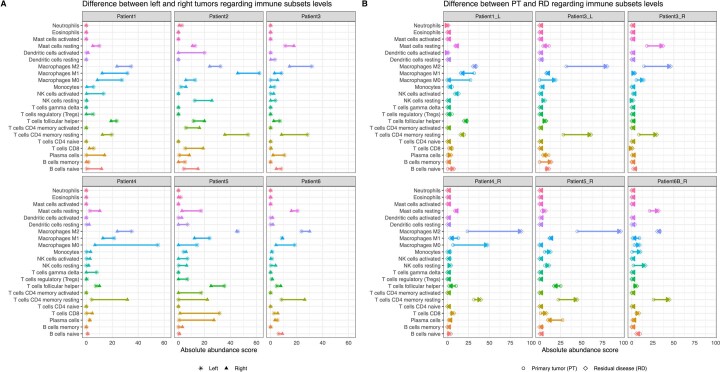
Extended Data Fig. 8. Comparison of the repartition of the subsets of immune subpopulation in the left and the right tumors of pairs of sBBCs and in the pre and post NAC pairs of sBBCs.
The analyses are performed in the in left, right, pre and post-NAC samples of the cohort of 6 patients (20 samples). Each subfigure represents the amount of immune subpopulation evaluated with the CIBERSORT algorithm; A. in the right tumor (triangle) and the paired left tumor (star). Both tumors of each side of patient 6 are averaged, as they show very minimal differences in the composition of the immune microenvironment; B in the primary tumor (PT) (circle) and the paired residual disease (RD) (diamond). Abbreviations: PT, primary tumor; RD, residual disease.

