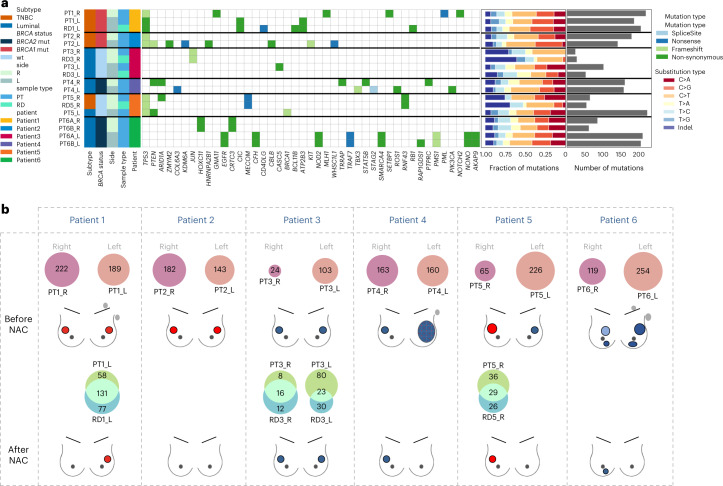
Fig. 2. Tumor mutation profiles.
The analyses were performed in the left, right, pre-NAC (PT) and post-NAC (RD) samples of a cohort of six patients (20 samples) with next-generation sequencing data available. a, Heat map of somatic driver mutations (including missense, nonsense and splicing) detected in six study patients and 20 samples. b, Venn diagrams showing the number of mutations shared between the left (pink) and the right (purple) primary tumors of a same patient and shared (intersect turquoise) between the PT (light green) and the corresponding specimen after NAC (RD, blue). The post-NAC samples RD4_R and RD6B_R were discarded owing to poor sample purity. Mutations from the two multicentric tumors of each side of patient 6 were merged. L, left; R, right; wt, wild-type.

