
Figure 1.
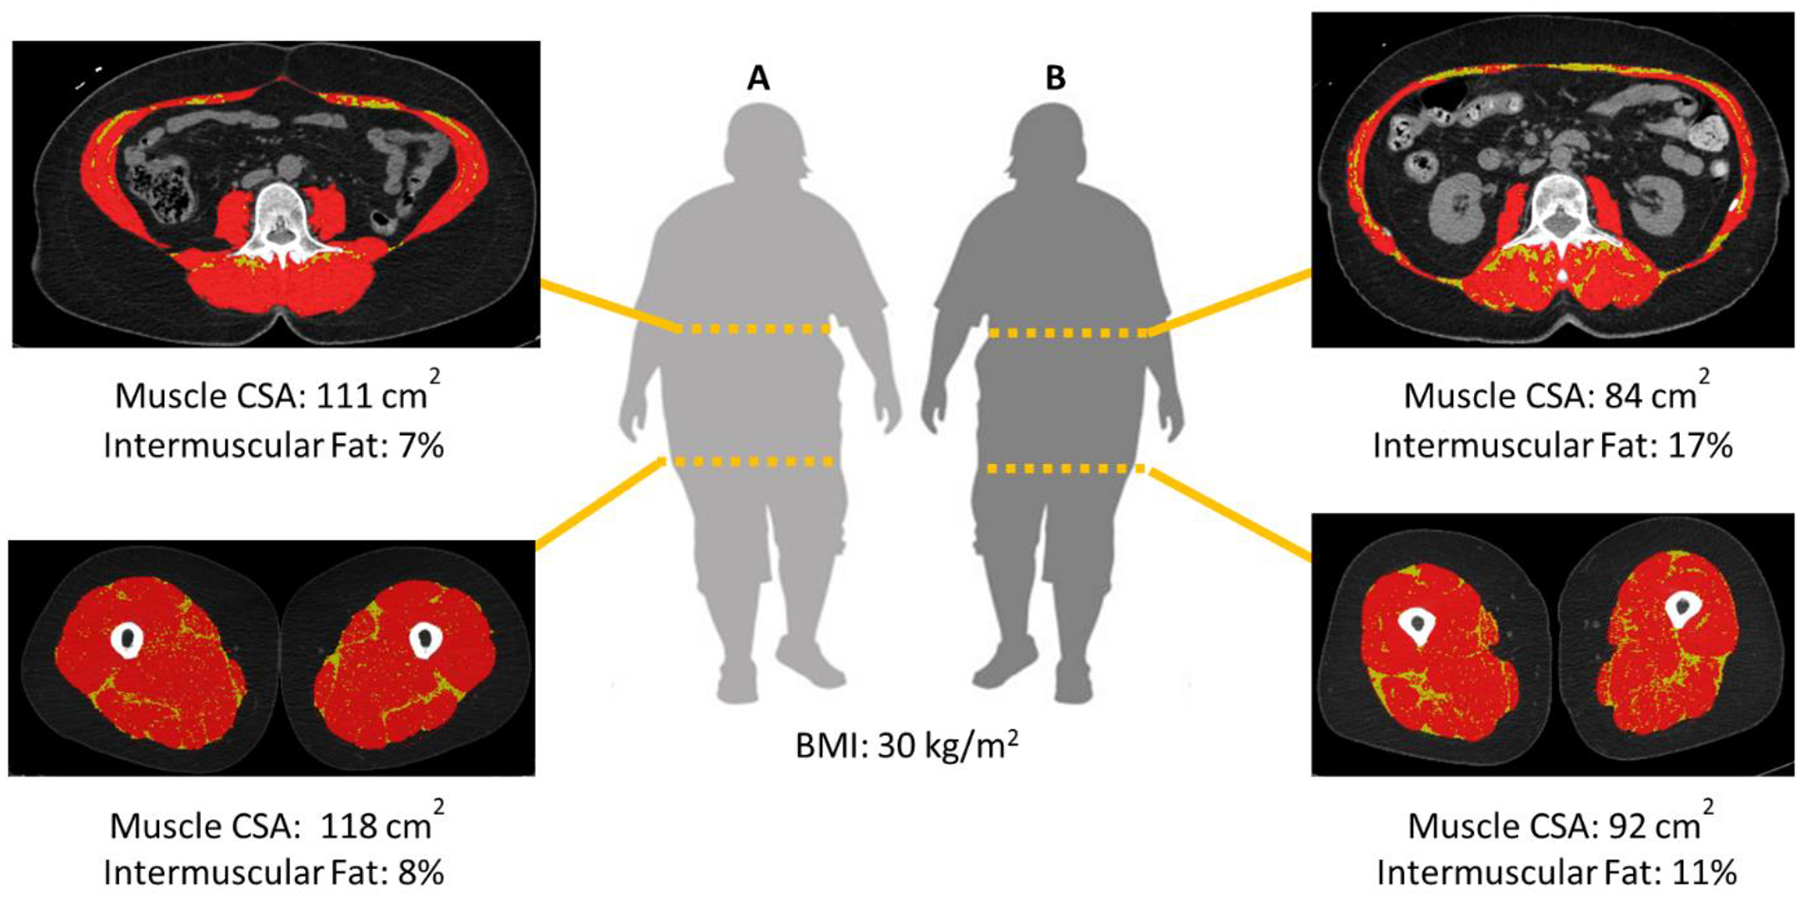
Examples of trunk and mid-thigh CT segmentations. The red area highlights the skeletal muscle cross-sectional area (CSA; −29 to 150 HU) and the yellow area highlights the intermuscular fat (−190 to −30 HU).
Official websites use .gov
A
.gov website belongs to an official
government organization in the United States.
Secure .gov websites use HTTPS
A lock (
) or https:// means you've safely
connected to the .gov website. Share sensitive
information only on official, secure websites.
Examples of trunk and mid-thigh CT segmentations. The red area highlights the skeletal muscle cross-sectional area (CSA; −29 to 150 HU) and the yellow area highlights the intermuscular fat (−190 to −30 HU).