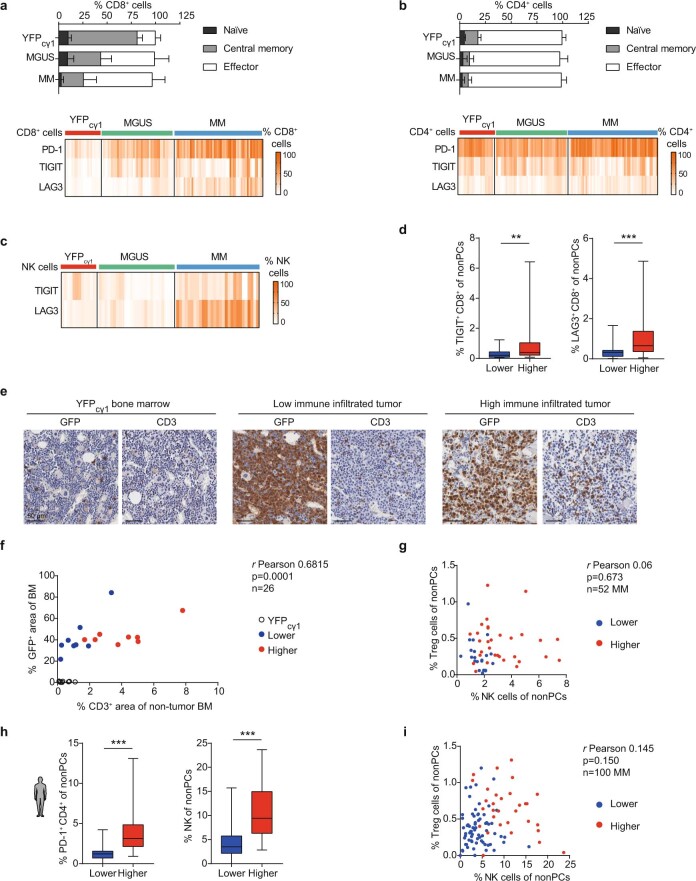
Extended Data Fig. 4. Immunological characteristics of genetically engineered mice with multiple myeloma.
a) Stage of CD8+ T cells (a) and CD4+ T cells (b) during MGUS (n = 8) and MM (n = 27) progression in mice. Controls corresponded to YFPcγ1 mice (n = 3). Phenotype of exhaustion markers in CD8+ T cells (a) and in CD4+ T cells (b) during MGUS (n = 24) and MM (n = 43) compared with control age-matched mice (n = 17) (complementary to Fig. 4a). Mean ±s.d. are represented. c) Percentage of NK cells with TIGIT and LAG3 expression in BM in YFPcγ1 control mice (n = 4) and in mice with MGUS (n = 6) and MM (n = 26) (complementary to Fig. 4a). d) Tumors with higher number of immune cells (n = 27-34) in the BM contained an increased number of tumor-reactive CD8+ T cells that expressed TIGIT, and LAG3, in contrast to those cases with lower immune infiltrates (n = 22-25) (complementary to Fig. 4d). e) Immunohistochemical studies using antibodies to detect GFP+ transgenic MM cells or CD3+ T lymphocytes in BM sections from YFPcγ1 control mice, BIcγ1 mice and MIcγ1 mice. f) Representation of the percentage (%) of the area in a region of interest in the BM that is occupied by CD3+ T cells with respect to non-GFP+ MM cells. Samples from YFPcγ1 control mice (n = 2), BIcγ1 mice (n = 2) and MIcγ1 mice (n = 2) were included. g) Pearson correlation analyses between the percentages of NK cells in the mouse BM and those of Treg cells in the BM (complementary to Fig. 4d). h) In MM patients, tumors with more abundant infiltrating immune cells (n = 31) contained an increased number of tumor-reactive PD-1+ CD4+ T cells and NK cells in the BM compared with MM cases with lower number of immune cells (n = 69) (complementary to Fig. 4g). i) Pearson correlation analyses between the percentages of NK cells in the BM of MM patients and those of Treg cells in the BM (complementary to Fig. 4h). Boxes represent median, upper and lower quartiles and whiskers represent minimum to maximum range (d and h). Two-tailed Mann-Whitney test P values (d and h) are indicated. **p < 0.01; ***p < 0.001.

