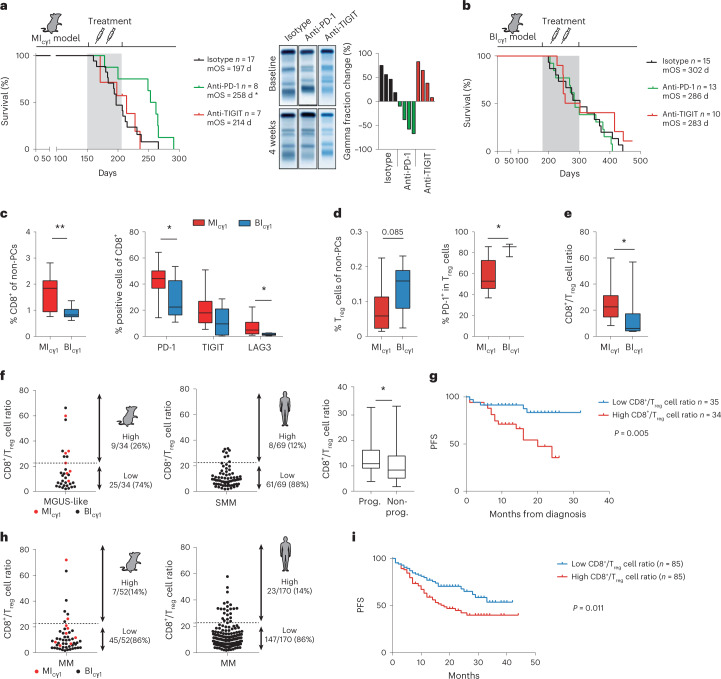
Fig. 5. Immunotherapy responses in multiple myeloma.
a, Preclinical immunotherapy trial in MIcγ1 mice testing anti-PD-1 or anti-TIGIT monoclonal antibodies with respect to isotype-treated mice. Kaplan–Meier OS curves and mOS values are shown. b, Preclinical immunotherapy trial in BIcγ1 mice testing anti-PD-1 or anti-TIGIT monoclonal antibodies with respect to isotype-treated mice. Kaplan–Meier OS curves and mOS values are shown. c, MIcγ1 mice (n = 10) exhibited higher numbers of activated PD-1+, TIGIT+ and LAG3+ CD8+ T lymphocytes in the BM compared with BIcγ1 mice (n = 9). d, The number of PD-1+ Treg cells in the BM of MIcγ1 mice (n = 9) was lower than in BIcγ1 mice (n = 9) at MGUS stages. e, The ratio of CD8+ T cells to Treg cells in the BM microenvironment was higher in MIcγ1 mice (n = 8) than in BIcγ1 mice (n = 9; median value, 22.5 versus 6.1; P = 0.019). f, Representation of the CD8+ T/Treg cell ratio in BM samples from mouse MM and from patients with SMM. Median value of CD8+ T/Treg cell ratios in SMM patients with progression versus those without progression at 2 years from diagnosis (P < 0.05; right). g, Kaplan–Meier PFS curve for patients with untreated SMM (n = 69). A high CD8+ T/Treg cell ratio was associated with shorter time to progression with respect to the remaining cases (median PFS at 2 years, 38% versus 88%; P = 0.005). h, In 170 newly diagnosed individuals with clinically active MM, 23 (14%) exhibited a high CD8+ T/Treg cell ratio, while the remaining patients (86%) showed lower CD8+ T/Treg cell ratios. i, Kaplan–Meier PFS curve for 170 MM patients aged >70 years treated with lenalidomide and dexamethasone in the GEM-CLARIDEX clinical trial (NCT02575144). The presence of a high BM CD8+ T/Treg cell ratio was associated with a higher rate of progression in comparison with those cases with low values (PFS, 18 months versus not reached; P = 0.011). Boxes represent the median, upper and lower quartiles and whiskers represent minimum to maximum range (c–f). Unpaired two-tailed Student’s t-test or Mann–Whitney test P values (c–f) are indicated. Log-rank (Mantel–Cox) test was used in a, b, g and i. *P < 0.05; **P < 0.01; ***P < 0.001.

