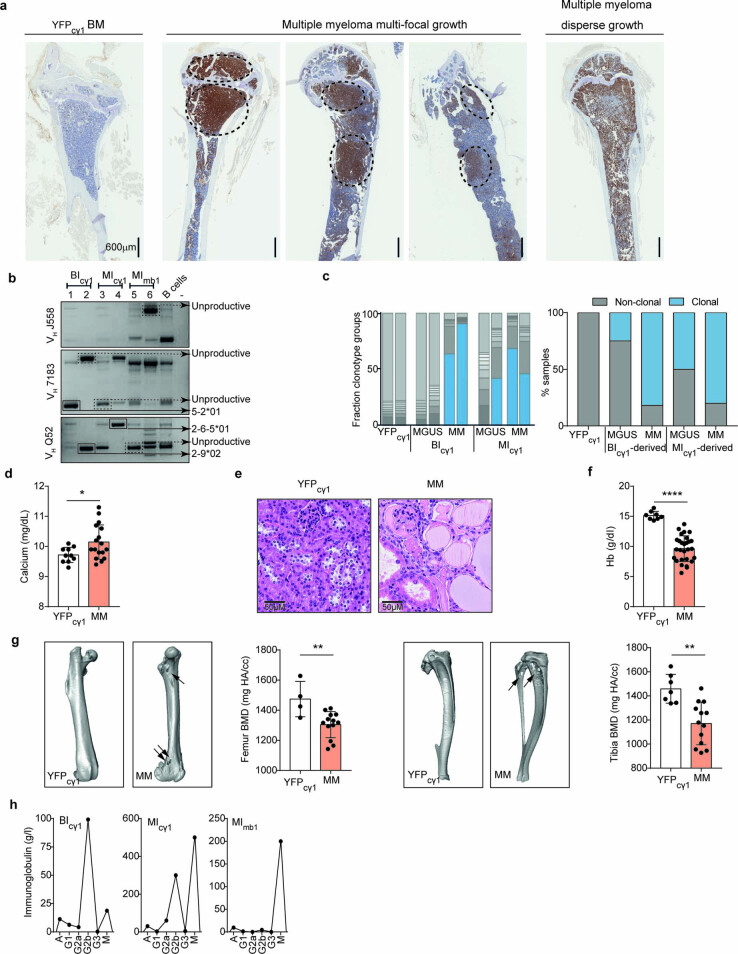
Extended Data Fig. 1. Characterization of multiple myeloma in genetically engineered mice.
a) Immunohistochemical analysis of bone sections using GFP staining to visualize the GFP+ MM cells within the BM (excluding by-stander GFP-negative PCs). Two MIcγ1 mice, two BIcγ1 mice and one YFPcγ1 control mice were characterized. A multifocal growth of MM is observed in three of the four examined mice, including focal lesions in the BM. b) Examination of tumor clonality by genomic PCR and sequencing revealed clonal IghV gene rearrangements in DNA isolated from BM PCs from two MImb1, two MIcγ1 and two BIcγ1 mice. As negative control, splenic B220+ B cells from a YFPcγ1 mouse were included. c) Representation of the fraction clonotype groups according to the tumor IghV gene clonality in two samples from BIcγ1 and MIcγ1 mice at MGUS and MM states, shown on the left. The percentage of samples with clonal and non-clonal IghV genes in BIcγ1-derived and MIcγ1-derived strains at MGUS and MM states is shown on the right. Representation of CRAB features in MImb1, MIcγ1, and BIcγ1 mice (n = 17-28), including hypercalcemia (d), renal disease due to Ig light-chain deposits in tubules (e), anemia (f), and bone disease (g). In g), presentative images of micro-computed tomography (micro-CT) performed in the bones of mice with MM are shown, which detected osteolytic lesions (marked with arrows) in femur (left) and tibia and fibula (right) in BIcγ1 and MIcγ1 mice, respectively. As controls, YFPcγ1 mice were characterized, which did not show bone lesions. In addition, quantification of bone density from micro-CT images was performed in 13 mice from different genotypes at the MM stage, which showed global decrease of bone mineral density (BMD) in femur (left) and tibia (right) with respect to controls(n = 4-7). Bars represent mean ± s.d. Unpaired two-tailed t Student test or Mann-Whitney test P values (d, f and g) are indicated. h) Representative examples of individual mice showing the quantification of Ig isotypes in serum samples by ELISA. *p < 0.05; **p < 0.01; ***p < 0.001; NS, non-significant.

