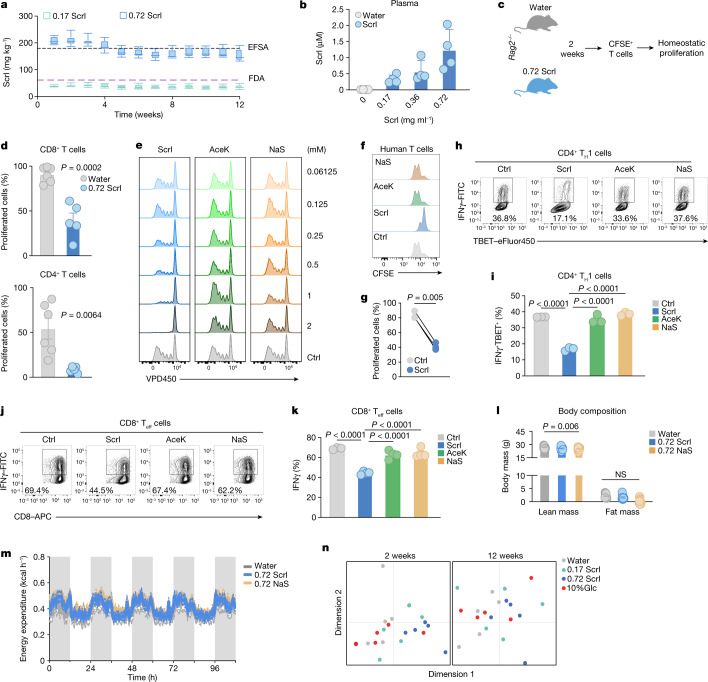
Fig. 1. Sucralose impairs T cell proliferation and differentiation.
a, Sucralose (Scrl) intake in mice given 0.72 mg ml−1 (blue; n = 6) or 0.17 mg ml−1 (aquamarine; n = 6) Scrl. In box plots, whiskers show the minimum and maximum values, box margins represent the first and third quartile and the central line is the median value. Dashed lines indicate the BSA-adjusted EFSA (black) and FDA (purple) maximum ADI. Scrl concentrations are indicated in mg ml−1 throughout. b, Circulating Scrl levels in mice given water containing different Scrl concentrations for 2 weeks. n = 4 individual mice per condition. c, Schematic of the experimental design. CFSE, carboxyfluorescein succinimidyl ester. d, Homeostatic proliferation of CD8+ and CD4+ donor T cells in individual Rag2−/− recipient mice given plain water (n = 6) or Scrl (n = 5). e, Histograms of CD8+ T cell proliferation in the presence of Scrl, AceK, NaS or control medium (Ctrl). f, Human CD8+ T cell proliferation in the presence of Scrl, AceK, NaS or control medium. g, Paired comparison of the percentage of proliferated CD8+ T cells in f. n = 3 independent donors. h, Representative flow cytometry plot of in vitro polarized CD4+ TH1 cells expressing IFNγ and TBET (also known as TBX21). i, The percentage of TH1 cells in h. n = 3 technical replicates per condition. j, Representative flow cytometry plot of CD8+ T cells expressing CD8 and IFNγ. k, Quantification of CD8+IFNγ+ cells in j. n = 3 (Ctrl) or n = 4 (Scrl, AceK and NaS) technical replicates per condition. l,m, Mice were given plain water (n = 9) or 0.72 mg ml−1 of either Scrl (n = 12) or NaS (n = 11). l, Body composition (lean versus fat mass). m, Average energy expenditure measured continuously during night (grey area) and day (white area). n, Multidimensional scaling of the faecal gut microbiome from mice given water (n = 5), 0.72 mg ml−1 Scrl (n = 5), 0.17 mg ml−1 Scrl (n = 5) or 10% (w/v) glucose (n = 5) for 2 (left) or 12 (right) weeks. Data are mean ± s.d. (b,i,k) or mean ± s.e.m. (d,l,m). Significance was tested using unpaired (d) or paired (g) two-tailed Student’s t-test; one-way ANOVA with Tukey’s (i,k) or Dunnet’s multiple comparison test for lean and fat mass independently (l) or two-way ANOVA (m). Data are representative of two (d) or three (e,h–k) independent experiments.

