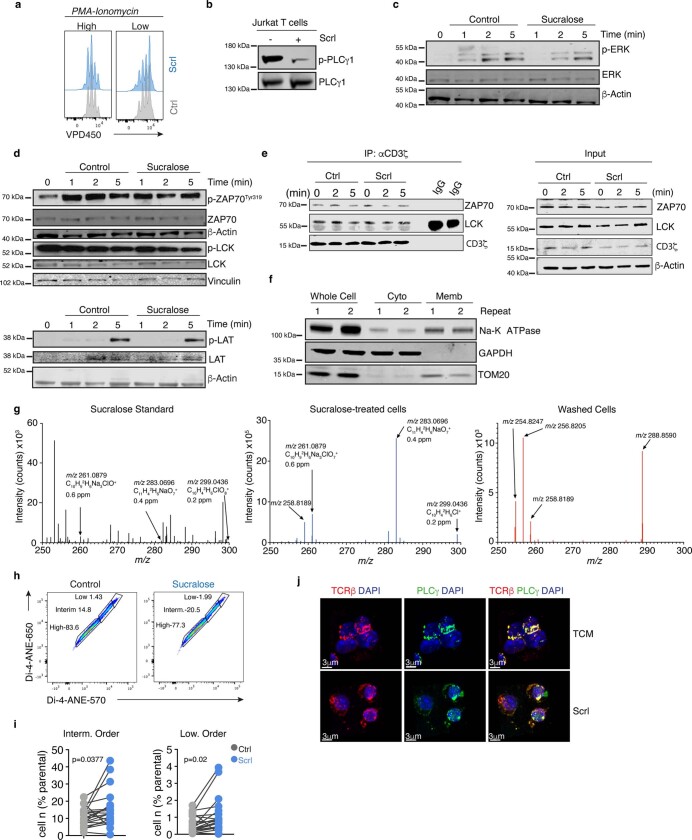
Extended Data Fig. 6. Sucralose reduces membrane order.
a) Flow cytometry histogram overlay of T cells loaded with VDP450 and activated with either high concentration of PMA (10 μg ml−1) and ionomycin (500 ng ml−1) (left) or low concentration (1 ng ml−1 PMA and 50 ng ml−1 ionomycin) (right), respectively. b) Western blot analysis of Jurkat T cells cultured with or without 0.5 mM Scrl and probed for p-PLCγ1 and PLCγ1 total. (c–d) Western blot analysis of T cells pre-treated for 2 h with or without 0.5 mM Scrl and activated with αCD3 (5 μg ml−1) for 1, 2, and 5 min. Membranes were probed for (c) p-ERK1/2 and total ERK1/2 expression, using β-Actin as loading control. All proteins detected on the same membrane. (d) Identical protein lysates were probed for p-ZAP70Tyr319, ZAP70, and β-Actin as loading control on one membrane and p-LCK, LCK and vinculin as loading control were probed on a second membrane. Second set of protein lysates were probed for p-LAT, LAT and β-Actin as loading control on the same membrane. e) Immunoprecipitation (IP) of CD3ζ chain from Jurkat T cells cultured media in presence or absence of 0.5 mM Scrl for 2 days. (Left) Cells were stimulated with 5 µg ml−1 αCD3 for 0’, 2’, 5’ min as indicated. (Right) Western blot analysis of protein lysates used for IP showing ZAP70, LCK and CD3ζ expression with β-Actin as loading control. All proteins detected on the same membrane. f) Western blot analysis of protein lysates from whole cell fractions, cytoplasmic fractions and membrane fractions were probed for Na-K ATPase (membrane marker), GAPDH (cytoplasmic marker) and TOM20 (mitochondrial marker). All proteins were detected on the same membrane. g) Cryogenic Argon GCIB Orbitrap mass spectra acquired through the entire depth of cells until substrate signal was detected, showing the presence of fragments of deuterium labelled sucralose (d-Scrl) in a sample containing Jurkat T cells treated with 0.5 mM d-Scrl for 48 h, and subsequent absence of any sucralose-related ions in a sample containing d-Scrl treated cells which were subsequently washed with PBS to remove any traces of d-Scrl in the media. Masses annotated with chemical formulas derive from d-Scrl. Identifications were performed in comparison with a standard of pure d-Scrl. h) Representative flow cytometry plot of membrane orders as detected with the Di-4-ANEPPDHQ dye. Low, intermediate, and high membrane order populations are denoted. i) Paired analysis of Intermediate and Low membrane order of CD8+ T cells activated with αCD3/CD28 for 3 days with or without 0.5 mM Scrl. n = 20 biologically replicates. j) Representative 3D reconstruction (Z-stacks) from naïve T cells pre-treated with or without 0.5 mM Scrl, followed by TCR-crosslinking. Images show colocalization of TCRβ (red), PLCγ1 (green), and nuclei are stained with DAPI. Bar = 3 μm. Statistical significance was tested using, paired (i) 2-tailed student’s t-test. Data represent one of 3 independent experiments (a–f, h–j).

