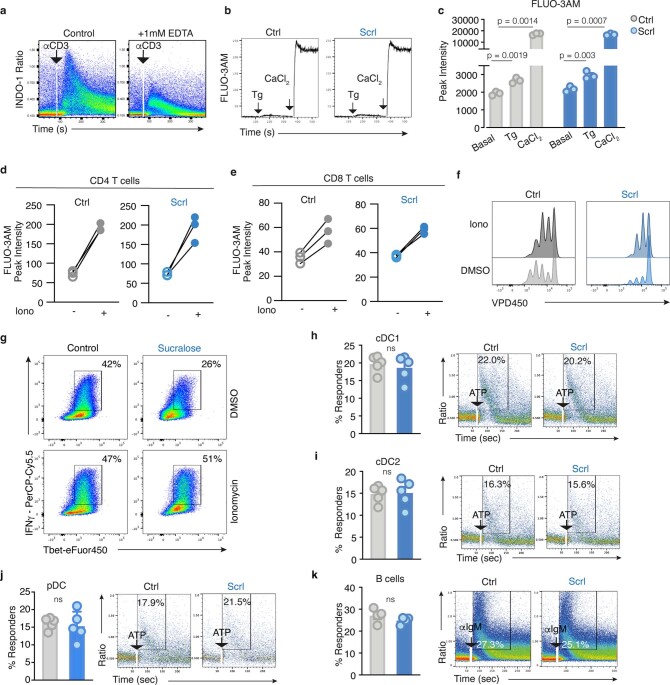
Extended Data Fig. 7. Sucralose selectively reduces TCR-induced intracellular calcium flux.
a) Representative intracellular calcium flux in naïve CD4+ T cells activated with αCD3-biotin crosslinked by streptavidin with or without 1 mM EDTA. Intracellular calcium flux is plotted as INDO1 ratio over time. b) Representative kinetic plot measuring calcium flux with FLUO-3AM using thapsigargin 1 μM (Tg) (first arrow) followed by 2 mM calcium chloride (CaCl2) (second arrow) in the presence or absence of 0.5 mM Scrl. The line represents mean values with gaussian smoothing. c) FLUO-3AM peak intensities upon Tg and CaCl2 treatments in CD4+ T cells in media lacking calcium salt. N = 3 biological replicates per condition. The statistical significance of Tg and CaCl2 vs Basal was tested using a paired 2-tailed Student’s t test with p values as reported in the figure. 2-way anova with Sidak’s multiple comparison test was used to test the effect of sucralose on the 3 conditions (Basal, Tg, and CaCl2). No significant effect was discovered. (d–e) Pairwise comparison of changes in FLUO-3AM peak intensity with ionomycin treatment in CD4+ (d) and CD8+ (e). N = 3 biological replicates per condition. T cells were tested in calcium-free media with or without 0.5 mM Scrl (blue). Each dot represents a biological replicate. f) Representative histogram plot of VPD450 dilution of total T cells activated with αCD3 (2 μg ml−1) and αCD28 (1 μg ml−1) in the presence of DMSO or 125 ng ml−1 of ionomycin with or without 0.5 mM Scrl. g) Representative flow cytometry plot of T cells activated with αCD3 (2 μg ml−1) and αCD28 (1 μg ml−1) in the presence of DMSO or 125 ng ml−1 of ionomycin with or without 0.5 mM Scrl and restimulated for ICS. Cytokine production is identified as Tbet+IFNγ+ populations. (h–j) FLT3-ligand generated conventional DC1 (n = 3/condition, technical replicates) (h), cDC2 (n = 3/condition, technical replicates) (i) and plasmacytoid DCs (n = 3/condition, technical replicates) ( j) differentiated in the presence or absence of 0.5 mM Scrl. Graphs on the left show the percentage of cells undergoing calcium flux in response to 1mM ATP. The representative flow cytometry plots (right) show the INDO1 ratio over time in response to ATP. k) Isolated naïve B cells stained with INDO1 and activated with αIgM (20 μg ml−1) in presence or absence of 0.5 mM Scrl. Graph (left) represents the percentage of calcium responding cells downstream of αIgM stimulation and on the right is a flow cytometry representative plot. N = 5 technical replicates per condition. Data present as mean value ±s.d. (c) or ±s.e.m. (h–k). Data representative of 3 independent experiments (h–k). Statistical significance was tested using paired (c–e) or unpaired 2-tailed Student’s t test (h–k).

