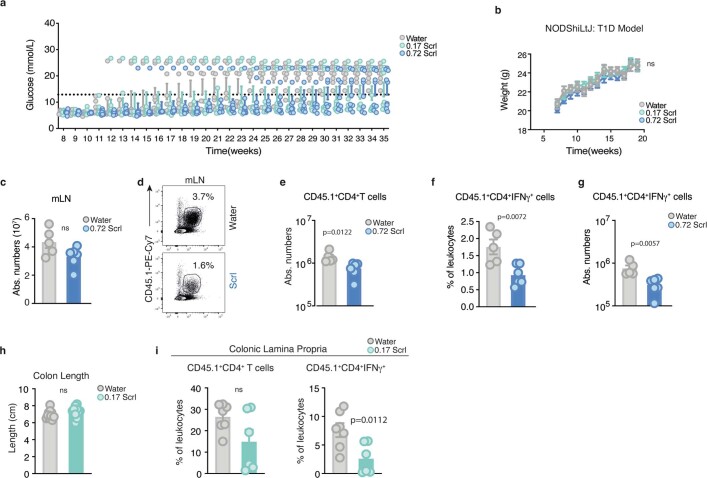
Extended Data Fig. 9. Sucralose delays the onset of T1D and reduces inflammatory T cells in a T-cell induced colitis model in mice.
a-b). NOD/ShiLtJ mice fed with either water (n = 8), 0.17 or 0.72 mg ml−1 Scrl (n = 9 for each dose) . a) Weekly blood glucose measurements. b) Weekly weight measurements. (c–g) T cell-induced colitis model of CD4+CD45RB+CD45.1+ congenic T cells transferred into CD45.2 TCRα−/− recipients that were fed either water (n = 5) or 0.72 mg ml−1 Scrl (n = 5). Inflammation was assessed at 21 days post T cell transfer. c) Total numbers of mesenteric lymph node (mLN) leukocytes. d) Representative density plot of the percentage of CD4+ CD45.1+ donor cells in the mLN of TCRα−/− recipients. e) Total numbers of donor congenic donor T cells in the mLN. f) Percentage of congenic CD4+ T cells producing IFNγ+ in the mLN. g) The absolute number of congenic CD4+IFNγ+ T cells within the mLN. (h–i) T-cell induced colitis model of CD45.1 congenic naive T cells adoptively transferred into CD45.2 TCRα−/− recipients that were fed either water or 0.17 mg ml−1 sucralose. h) Colon length at 21 days post transfer (n = 8/group). i) Frequency of CD45.1 CD4+ donor T cells producing IFNγ in the colonic lamina propria at 21 days post transfer. Water (n = 7) versus 0.17 mg ml−1 sucralose (n = 6). Data presented as mean value ±s.e.m. (a–c, e–i). Each dot represents an individual mouse (a, c, e–i). Statistical significance was tested using unpaired 2-tailed Student’s t test (c, e–i) and mixed-effects model (REML) (b). Data are representative of 2 (c, e–g) or 3 (i, h) individual experiments.

