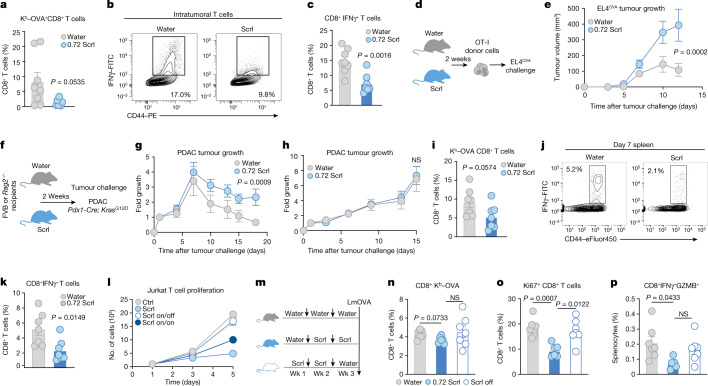
Fig. 3. Sucralose treatment limits T cell-specific responses in vivo.
a–c, CD8 antigen-specific responses to subcutaneous EL4-OVA tumour growth in mice given water (n = 8) or 0.72 mg ml−1 Scrl (n = 7). a, Quantification of intratumoral CD8–MHC tetramer (Kb)–OVA-specific T cells. b, Representative flow cytometry plot of intratumoral cells re-stimulated with OVA peptide and analysed for IFNγ and CD44. c, Percentage OVA-specific T cells expressing IFNγ. d,e, The OT-I tumour-rejection model. Mice given water or 0.72 mg ml−1 Scrl (n = 10 per condition). d, Schematic overview of the model. e, Volumes of EL4-OVA tumours. f,g,h, MHC-mismatched tumour model using KrasG12D pancreatic ductal adenocarcinoma (PDAC) cells in recipient mice given water (n = 9) or 0.72 mg ml−1 Scrl (n = 8). f, Schematic overview of the model. g, Tumour growth in FVB recipient mice. h, Tumour growth in Rag2−/− recipient mice. i–k, C57BL/6J mice given water (n = 7) or 0.72 mg ml−1 Scrl (n = 7) challenged with LmOVA. i, The percentage of splenic OVA-specific CD8+ T cells. j, Representative flow cytometry plot of splenocytes re-stimulated with OVA peptide and analysed for expression of CD44 and IFNγ. k, The percentage of splenic CD8+ T cells expressing IFNγ. l, Representative proliferation of Jurkat T cells in T cell media (Ctrl) or exposed to acute (Scrl), chronic (Scrl on/on) or transient (Scrl on/off) 0.5 mM Scrl. n = 3 per condition. representative of 3 independent experiments. m–p, T cell responses at day 7 after LmOVA infection. Mice given water (n = 7), 0.72 mg ml−1 Scrl (n = 6) or 0.72 mg ml−1 Scrl for 2 weeks followed by water for one week (n = 7, Scrl off). m, Schematic experimental overview. n, Percentage of splenic Kb–OVA-specific CD8+ T cells. o, The frequency of splenic Ki67+CD8+ T cells. p, The frequency of total IFNγ and granzyme B (GZMB) expression in splenic CD8+ T cells after re-stimulation with OVA peptide. Data are mean ± s.e.m. (a,c,e,g–i,k,l,n–p). Each dot represents a biological (a,c,e,g–i,k,n–p) or technical (l) replicate; data are representative of two (e,g,i,k) or three (l) independent experiments. Significance was tested using unpaired two-tailed Student’s t-test (a,c,i,k); Brown–Forsythe and Welch ANOVA test with Dunnett’s T3 comparison (n–p); two-way ANOVA (e,g,h). NS, not significant.

