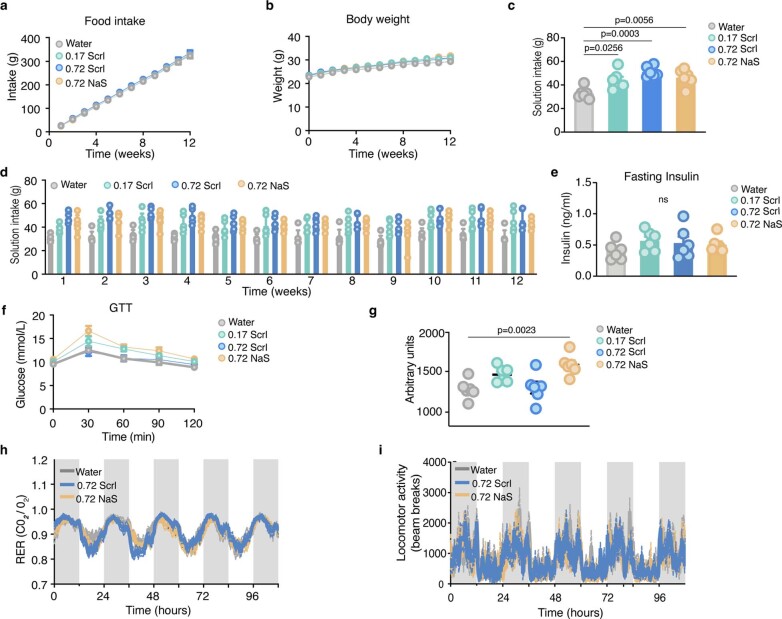
Extended Data Fig. 3. Sucralose does not affect whole body mouse metabolism.
(a–g) Individually caged C57BL/6J mice fed water, 0.17 mg ml−1 Scrl, 0.72 mg ml−1 Scrl) or 0.72 mg ml−1 sodium saccharin (NaS) for 12 weeks. N = 6 per treatment. a) Average cumulative food intake. b) Average body weight. c) Average solution intake. d) Weekly solution intake. e) Fasting plasma insulin levels. (f–g) Glucose tolerance test (GTT) of mice receiving an oral bolus of 2 mg kg−1 glucose. f) Blood glucose. g) Area under the curve calculated using the trapezoid method for the GTT. h–i) C57BL/6J mice fed for over 8 weeks with water (n = 8 for RER and 9 for locomotor activity), 0.72 mg ml−1 Scrl (n = 12) or 0.72 mg ml−1 NaS (n = 11). h) Respiratory Exchange Ratio (RER). i) Locomotor activity. Data are displayed as mean ± s.d. (d) ± s.e.m. (a, b, c, e, f, g, h, i). Each dot represents a single mouse. Statistical significance was determined using one-way Anova with Tukey’s (a, b, c) or Dunnet’s (e, g) multiple comparison test.

