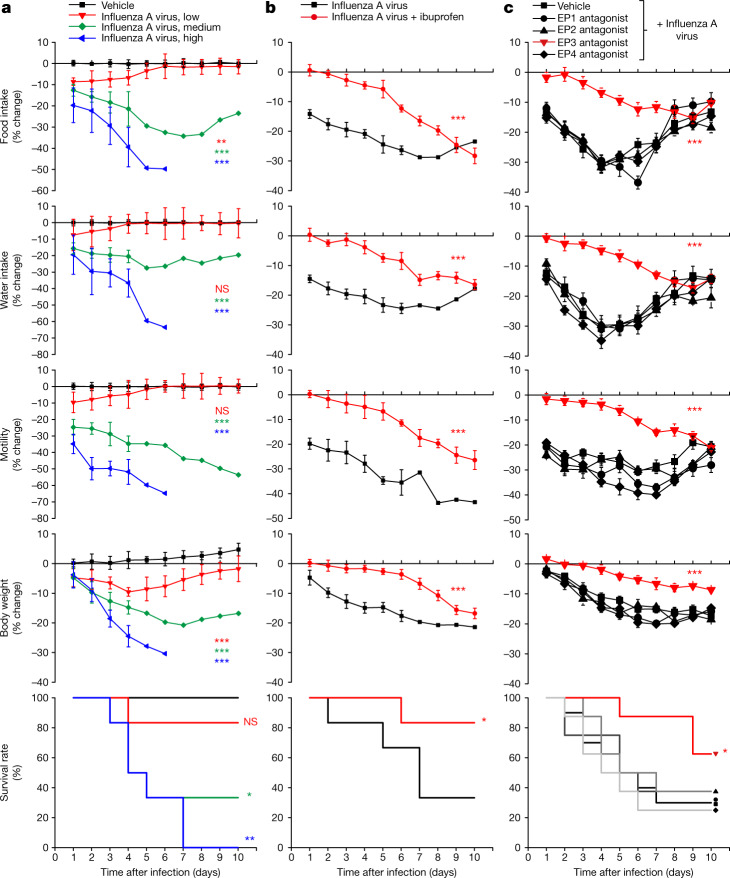
Fig. 1. Influenza infection induces multiple sickness symptoms through the EP3 receptor.
a, Mice were infected intranasally with 25 μl of influenza A virus at low (105 EID50 ml−1), medium (106 EID50 ml−1) or high (107 EID50 ml−1) dose and food intake, water intake, motility and body weight were subsequently monitored daily. EID50 is the 50% egg infective dose. Data are mean ± s.e.m.; n = 6 mice per group. One-way ANOVA with Dunnett’s multiple comparison test compared with vehicle control. Food intake: P = 0.0048 (low), P < 0.0001 (medium), P < 0.0001 (high). Water intake: P = 0.8185 (low), P < 0.0001 (medium), P < 0.0001 (high). Motility: P = 0.5231 (low), P < 0.0001 (medium), P < 0.0001 (high). Body weight: P = 0.0002 (low), P < 0.0001 (medium), P < 0.0001 (high). Survival: P = 0.3173 (low), P = 0.0185 (medium), P = 0.0007 (high). b, Mice were infected with influenza A virus (all infections are with 106 EID50 ml−1 unless otherwise indicated), given drinking water with or without 1 mg ml−1 ibuprofen, and monitored as indicated. Data are mean ± s.e.m.; n = 6 mice per group. Food intake: P < 0.0001; water intake: P = 0.0001; motility: P = 0.0001; body weight: P < 0.0001; survival: P = 0.0295. c, Mice were infected with influenza A virus, injected daily (intraperitoneal injection, 1 mg kg−1) with antagonists for EP1 (SC-51322), EP2 (PF-04418948), EP3 (DG-041) or EP4 (ONO-AE3-208), or vehicle alone, and monitored as indicated. Data are mean ± s.e.m.; n = 10 mice for vehicle groups; n = 8 mice for all others. For EP3 antagonist—food intake: P < 0.0001; water intake: P < 0.0001; motility: P < 0.0001; body weight: P = 0.0002; survival: P = 0.0094. b,c, Two-tailed unpaired t-test, with comparisons between groups treated with ibuprofen or EP3 antagonist and vehicle in c. Log-rank (Mantel–Cox) test for survival analyses; for behavioural or physiological changes, a mean daily change in behaviour (days 1–10 after infection or survival) was obtained for each mouse, and then used for comparisons across experimental groups (for more information see Extended Data Fig. 1a). *P < 0.05, **P < 0.005, ***P<0.0005; NS, not significant.

