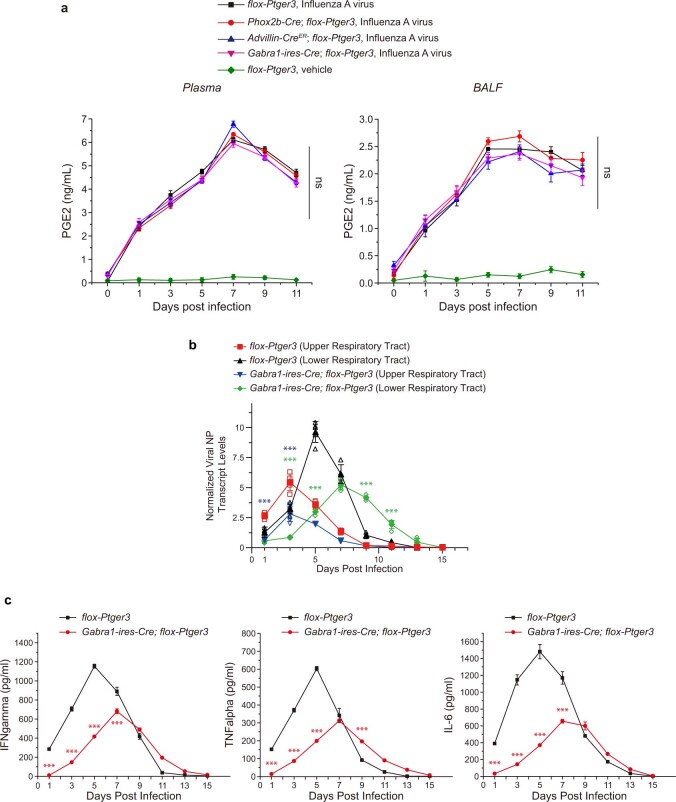
Extended Data Fig. 9. Impact of targeted Ptger3 knockout on cytokines and viral transcript levels.
a, PGE2 levels in plasma (left) and BALF (right) were measured by ELISA in mice indicated at various time points after exposure to influenza A virus or PBS control, mean ± sem, n: 5 mice per group, ns: not significant by two-way ANOVA involving analysis of influenza virus-infected groups. b, qPCR analysis of viral nucleoprotein (NP) transcript levels in the upper and lower respiratory tract of flox-Ptger3 and Gabra1-ires-Cre; flox-Ptger3 mice after influenza virus infection, normalized to Gapdh and uninfected controls, mean ± sem, n: 5 mice per group, ***p < 0.0005 by two-way ANOVA followed by Bonferroni’s multiple comparison test with comparisons made between red and blue curves (blue stars) or black and green curves (green stars). c, Levels of IFNγ, TNFα, and IL-6 in BALF were measured by ELISA at time points indicated after exposure to influenza A virus in flox-Ptger3 (black) or Gabra1-ires-Cre; flox-Ptger3 (red), mean ± sem, n: 3 mice per group, ***p < 0.0005 by two-way ANOVA followed by Bonferroni’s multiple comparison test with comparisons made between red and black curves (red stars). p values in a: 0.1591, 0.0662, b and c: <0.0001 for all indicated stars.

