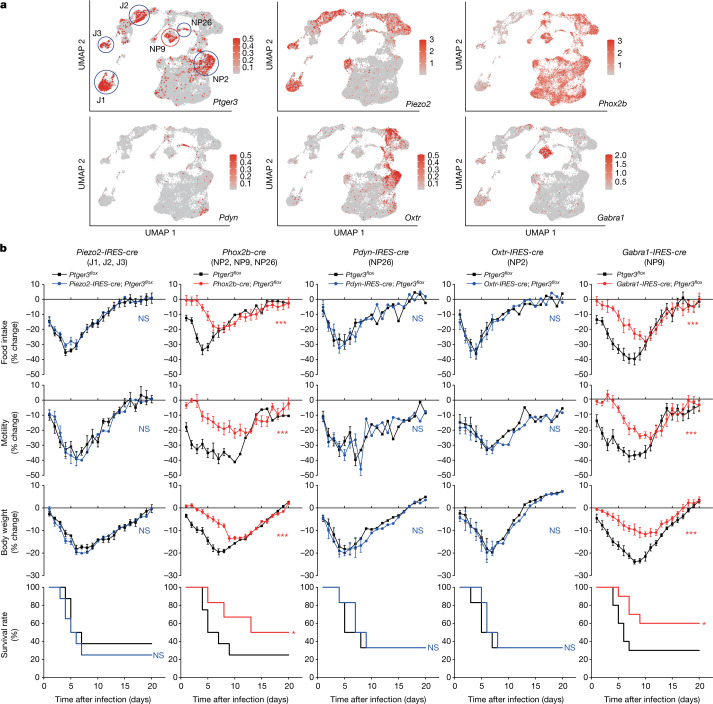
Fig. 3. Rare transcriptome-defined sensory neurons mediate influenza responses.
a, A uniform manifold approximation and projection (UMAP) plot derived from published single-cell transcriptome data of vagal and glossopharyngeal sensory ganglia22 showing expression of indicated genes (colour shows relative expression on a natural log scale). b, Cell types, as highlighted in a, express the indicated gene as well as Ptger3. Mice were infected with influenza A virus and monitored as indicated. Data are mean ± s.e.m.; n = 8 (Piezo2-IRES-cre), n = 6–8 (Phox2b-cre; 8 control and 6 Phox2b-cre), n = 6 (Pdyn-IRES-cre), n = 6 (Oxtr-IRES-cre) and n = 10 (Gabra1-IRES-cre) mice per group. Two-tailed unpaired t-test as detailed in Fig. 1 for behaviour or physiology analyses; log-rank (Mantel–Cox) test for survival analysis. Piezo2-IRES-cre—food intake: P = 0.2631; motility: P = 0.2680; body weight: P = 0.7925; survival: P = 0.4736. Phox2b-cre—food intake: P < 0.0001; motility: P < 0.0001; body weight: P = 0.0002; survival: P = 0.0181. Pdyn-IRES-cre—food intake: P = 0.4539; motility: P = 0.4946; body weight: P = 0.2675; survival: P = 0.7937; Oxtr-IRES-cre—food intake: P = 0.4786; motility: P = 0.6333; body weight: P = 0.3297; survival: P = 0.7121; Gabra1-IRES-cre—food intake: P = 0.0001; motility: P < 0.0001; body weight: P = 0.0004; survival: P = 0.0263.

