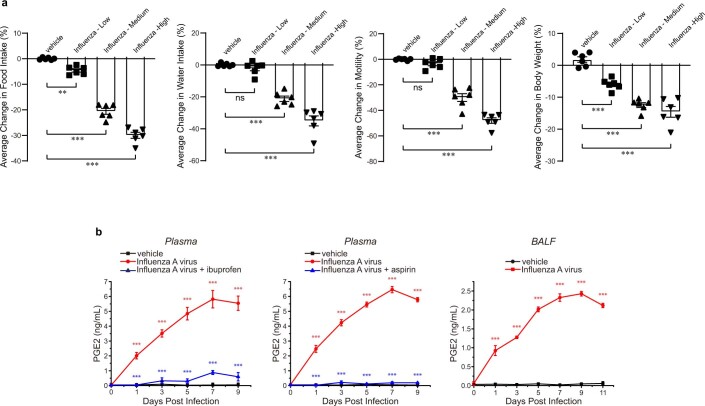
Extended Data Fig. 1. Influenza A infection induces behavioral changes and PGE2 production.
a, Statistical analysis for behavioral experiments involved averaging daily changes in parameters indicated per mouse (days 1-10 after infection or through survival), as represented here in bar graphs. Statistical values are identical to those in Fig. 1a. b, PGE2 levels in plasma (left, middle) and BALF (right) were measured by ELISA at time points indicated after exposure to influenza A virus (red, blue) or vehicle control (black). Some virus-infected mice (blue) were additionally given ad libitum access to ibuprofen (1 mg/ml) in drinking water from 3 days prior to infection (left) or received daily aspirin administration (IP, 20 mg/kg), mean ± sem, n: 3 mice per group, ***p < 0.0005 by two-way ANOVA followed by Bonferroni’s multiple comparison test with comparisons made between red and black curves (red stars) or red and blue curves (blue stars). p values in b are <0.0001 for all indicated stars.

