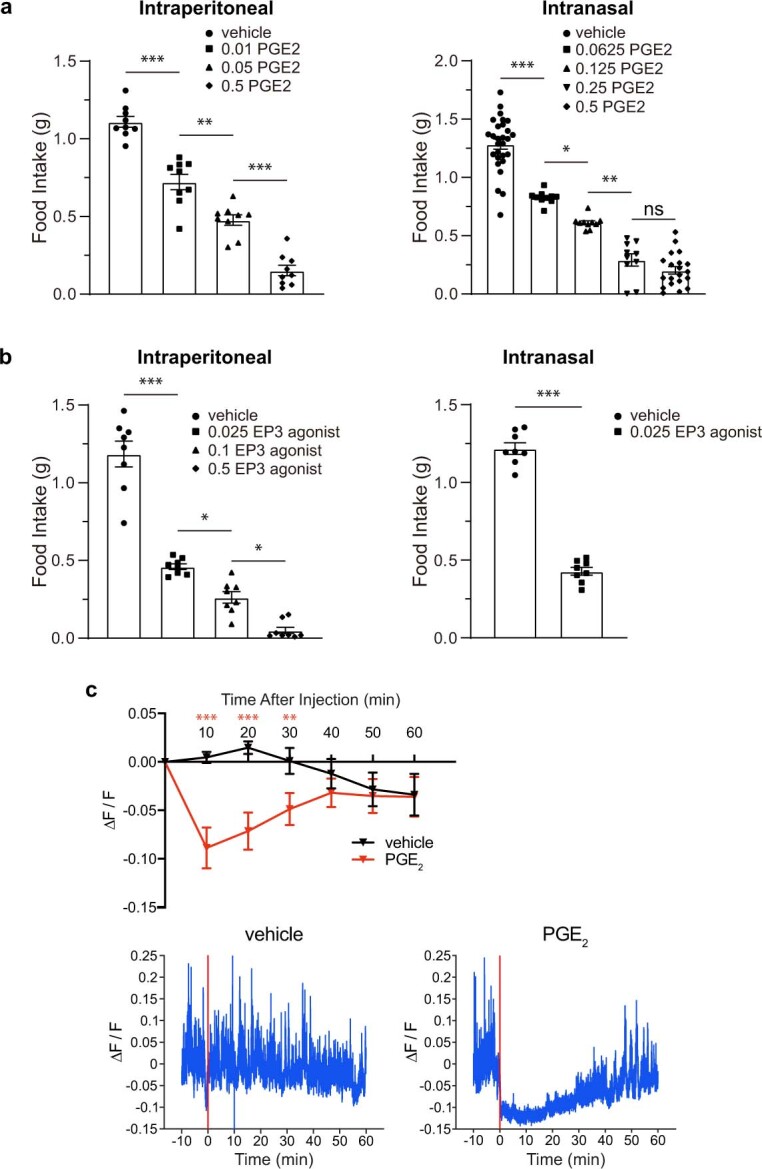
Extended Data Fig. 2. PGE2 decreases feeding and AGRP neuron activity.

a, Food intake by fasted mice administered with PGE2 (left: IP, right: intranasal) at doses indicated (mg/kg), and given ad libitum access to food (1 h), mean ± sem, n: 9 (left) mice per group, 28 (vehicle), 10 (0.0625, 0.125, 0.25), 20 (0.5) in (right), ***p < 0.0005, **p < 0.005, *p < 0.05, ns: not significant by two-way ANOVA Tukey’s multiple comparison test. b, Food intake by fasted mice administered with the EP3 receptor agonist sulprostone (left: IP, right: intranasal) at doses indicated (mg/kg), and given ad libitum access to food (1 h), mean ± sem, n: 8 mice per group, ***p < 0.0005, *p < 0.05 by two-way ANOVA Tukey’s multiple comparison test (left) or two-tailed unpaired t-test (right). c, GCaMP6s fluorescence (ΔF/F) was measured in AGRP neurons of the arcuate nucleus by fiber photometry before and after IP injection of PGE2 (0.5 mg/kg in PBS) or vehicle alone (PBS). (top) Responses are depicted as the mean of measurements made in 10-minute time intervals (for example, 10 refers to the mean of measurements made between 0 and 10 min), mean ± sem, n: 12 mice per group, **p < 0.01, ***p < 0.001 by two-way ANOVA with Bonferroni’s multiple comparison test, (bottom) representative recording traces with red bar indicating time of injection. p values left to right in a: IP: <0.0001, 0.0005, <0.0001, intranasal: <0.0001, 0.0455, 0.0008, 0.6630; b, IP: <0.0001, 0.0312, 0.0187, intranasal: <0.0001; c: <0.0001, <0.0001, 0.0045.
